The series plot is a popular way to visualize response data over a continuous axis like date with a group variable like treatment. Here is some data I made up of a response value by date, treatment, classification and company that makes the drug. The data is simulated as shown in the attached program (see bottom of article).
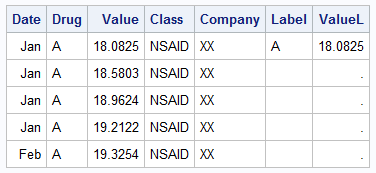 The data includes the columns VALUE, DATE, DRUG, CLASS and COMPANY. The columns LABEL and VALUEL are computed at every 5th observation per drug for labeling.
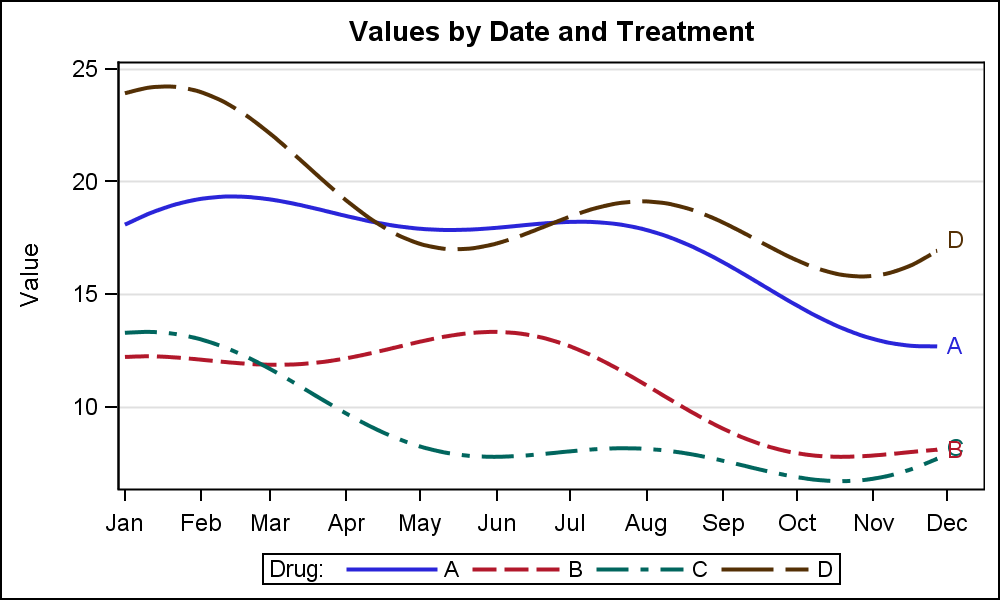 We can use the GTL SERIESPLOT to display Value by Date and Drug as shown on the right. Click on the graph to see a higher resolution graph. The drug name for each curve is displayed at the right end of the curve, and also in the legend below. We could turn off the legend if needed.
If a GROUP variable is not provided, the entire data is plotted as one series. When a GROUP variable is provided, the data is plotted as one curve for each group value. Each curve gets the display attributes such as color and line pattern from one of the GraphData01 - 12 style elements, in the order the group values are encountered in the data. Alternatively, one can also use a Discrete Attributes Map to assign specific color and line pattern values by group value.
Sample code shown here is for SAS 9.4. While some new options may not work, the basic ideas discussed below also works at SAS 9.3 or earlier.
SAS 9.4 GTL code for series with group:
proc template; define statgraph Series; begingraph / subpixel=on; entrytitle 'Values by Date and Treatment'; layout overlay / xaxisopts=(display=(ticks tickvalues)) yaxisopts=(griddisplay=on); seriesplot x=date y=value / group=drug name='a' lineattrs=(thickness=2) smoothconnect=true; discretelegend 'a' / title='Drug:'; endlayout; endgraph; end; run; proc sgrender data=SeriesGroup template=Series; run; |
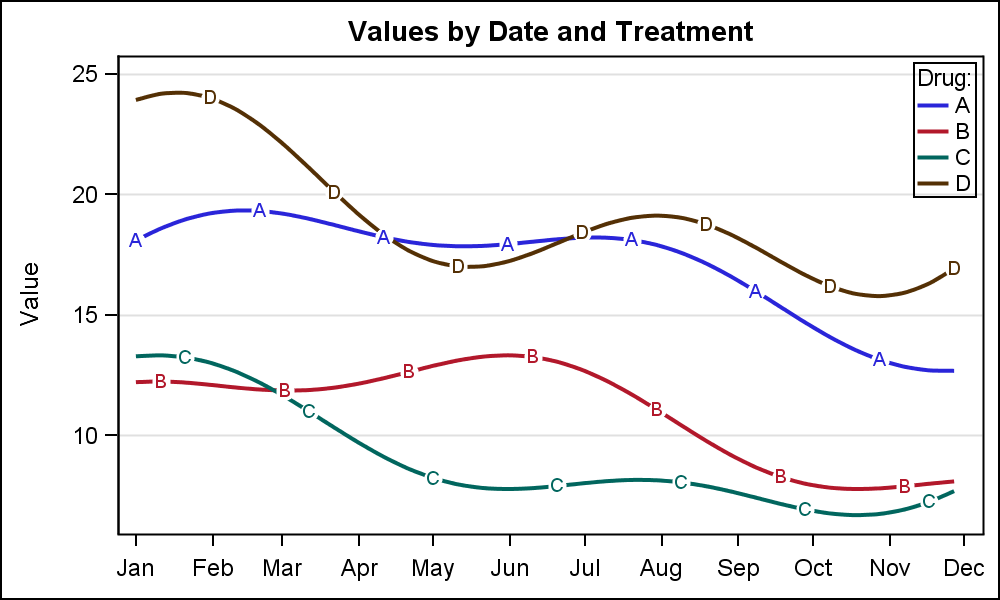 Note, the curve labels drawn at the end can get cluttered, as happened above for groups B and C. To improve this situation, we can label each curve along its length at frequent intervals. We do this by using the columns LABEL and VALUEL, which have non missing values at every 5th observation per group.
We can use these columns to overlaying a scatter plot with the marker character option. To reduce clutter of overlaid text, we add a white marker behind each letter. We discussed such ideas in Labeled Curves.
SAS 9.4 GTL code for curves with inline labels.
proc template; define statgraph SeriesLabel; begingraph / subpixel=on; entrytitle 'Values by Date and Treatment'; layout overlay / xaxisopts=(display=(ticks tickvalues)) yaxisopts=(griddisplay=on); seriesplot x=date y=value / group=drug name='a' lineattrs=(thickness=2) smoothconnect=true; scatterplot x=date y=valueL / group=drug markerattrs=(symbol=circlefilled color=white size=10); scatterplot x=date y=valueL / group=drug markercharacter=label; discretelegend 'a' / title='Drug:' itemsize=(linelength=15px) location=inside across=1 halign=right valign=top; endlayout; endgraph; end; run; |
In the program above, we have also used ATTRPRIORITY=COLOR on the ODS GRAPHICS statement to delay the use of patterns till after all colors are exhausted. See attached full program. This option makes all regular styles behave like the HTMLBLUE style. Each group is rendered by a different color from the style, using a total of four colors.
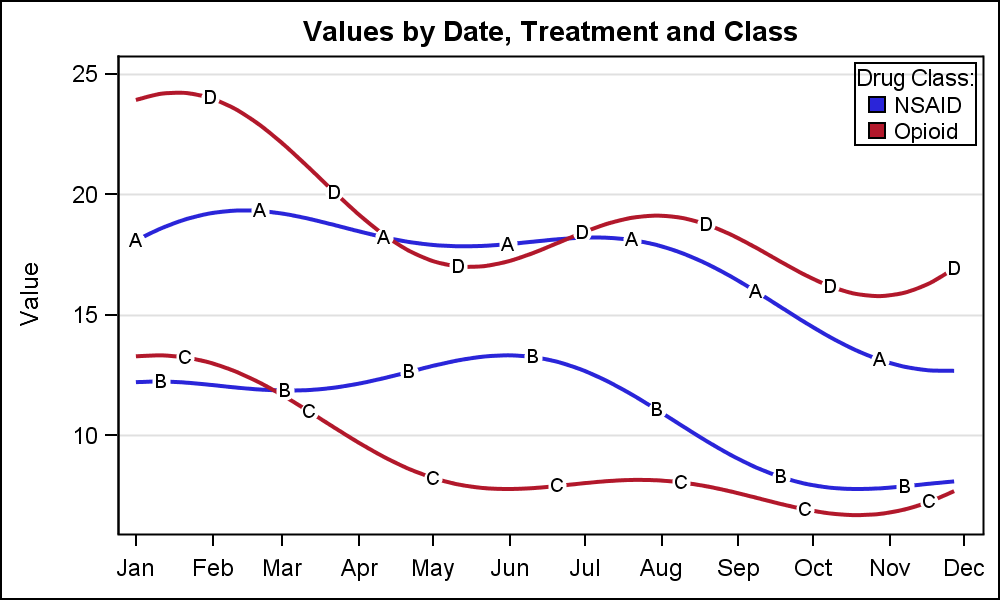 Now, we want to be able to group the curves for each drug by another grouping variable like the drug class. I assigned two classes "NSAID" and "Opioid". Since each curve is labeled by the name of the drug, we want to use the color to depict the class of the drug. We can do this by using a secondary group role called LINECOLORGROUP. The graph is shown on the right where each curve is now colored either blue or red based on the drug class. The legend contains a color swatch with its value.
SAS 9.4 GTL code for line color by a group:
proc template;
  define statgraph SeriesLineColorGroup;
    begingraph / subpixel=on;
      entrytitle 'Values by Date, Treatment and Class';
      layout overlay / xaxisopts=(display=(ticks tickvalues))
                       yaxisopts=(griddisplay=on);
        seriesplot x=date y=value / group=drug name='a' lineattrs=(thickness=2)
                   smoothconnect=true linecolorgroup=class;
        scatterplot x=date y=valueL / group=drug
                  markerattrs=(symbol=circlefilled color=white size=10);
        scatterplot x=date y=valueL / group=drug markercharacter=label
                  markercharacterattrs=graphdatatext;
        discretelegend 'a' / title='Drug Class:' type=linecolor location=inside
                  across=1 halign=right valign=top;
      endlayout;
    endgraph;
  end;
run;
Note the features of the graph above:
- We have labeled each treatment curve by its own label, so no need for a legend for this case.
- We have assigned the color for each curve by a secondary group variable CLASS.
- We have used a Discrete Legend of TYPE=LINECOLOR. This displays only color swatchs.
- The only requirement here is that the GROUP variable must be the lowest grouping factor for each curve. The LINECOLORGROUP value must remain the same for all obs with same GROUP value.
The good news here is that LINECOLORGROUP has been available in GTL SERIESPLOT all along since SAS 9.2. It is used by the POWER procedures, but the feature was tested only for the POWER procedures' use cases. Hence, we did not feel confident we could document this feature as ready for general use. Now, after hearing multiple users express the need for such use cases, we felt it was necessary to release this as production. Now this feature has been well tested, and no problems have been found. So, we feel the risk-to-reward ratio is in favor of exposing this feature to you.
In addition to LINECOLORGROUP, you can also use LINEPATTERNGROUP, MARKERCOLORGROUP and MARKERSYMBOLGROUP. Each one can be used with the group variable and this value should not change withing a GROUP value.
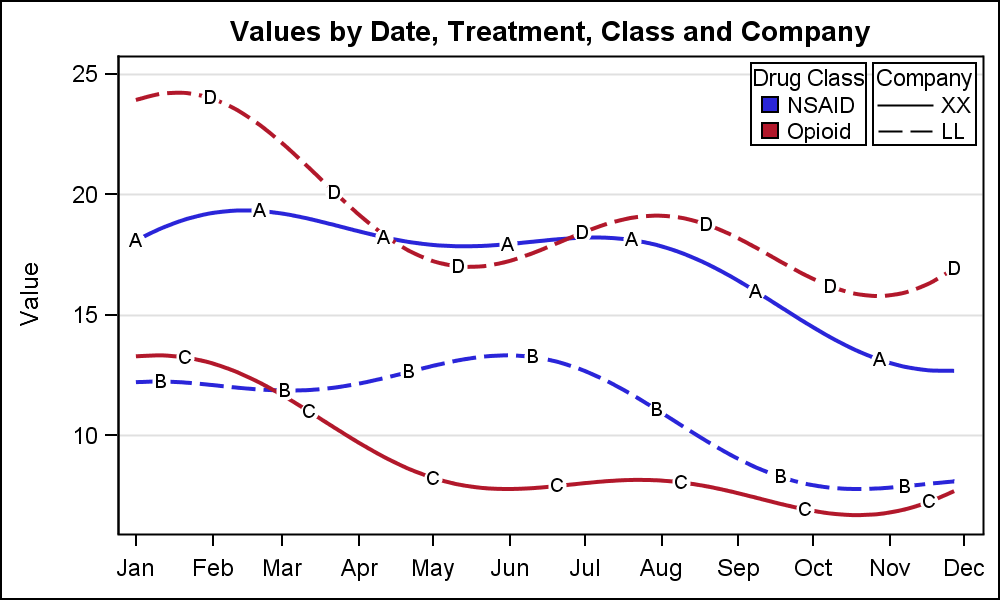
In the graph on the right, I have used COMPANY as the LINEPATTERNGROUP. Now, each drug is colored by its CLASS and patterned by the COMPANY. I have also added a discrete legend of TYPE=LINEPATTERN. Both these legends are wrapped inside a LAYOUT GRIDDED and placed at the top right of the cell.
SAS 9.4 GTL code for series with line color and line pattern groups:
proc template; define statgraph SeriesLineColorPatternGroup; begingraph / subpixel=on; entrytitle 'Values by Date, Treatment, Class and Company'; layout overlay / xaxisopts=(display=(ticks tickvalues)) yaxisopts=(griddisplay=on); seriesplot x=date y=value / group=drug name='a' lineattrs=(thickness=2) smoothconnect=true linecolorgroup=class linepatterngroup=company; scatterplot x=date y=valueL / group=drug markerattrs=(symbol=circlefilled color=white size=10); scatterplot x=date y=valueL / group=drug markercharacter=label markercharacterattrs=graphdatatext; layout gridded / halign=right valign=top columns=2 columngutter=5; discretelegend 'a' / title='Drug Class' type=linecolor location=inside across=1 halign=right valign=top; discretelegend 'a' / title='Company' type=linepattern location=inside across=1 halign=right valign=top itemsize=(linelength=30); endlayout; endlayout; endgraph; end; run; |
Note the features of the graph above:
- We have labeled each treatment curve by its own label, so no need for a legend for this case.
- We have assigned the color for each curve by a secondary group variable CLASS.
- We have assigned the pattern for each curve by a secondary group variable COMPANY.
- We have used a Discrete Legend of TYPE=LINECOLOR. This displays only color swatches.
- We have used a Discrete Legend of TYPE=LINEPATTERN. This displays patterns without color.
- The only requirement here is that the GROUP variable must be the lowest grouping factor for each curve. The LINECOLORGROUP and LINEPATTERNGROUP variables must remain the same for all obs with same GROUP value.
While you can display many different classifications in the graph at the same time, the graph can become complex very quickly. You can turn on the display of the markers for the series plot, and then control the visual attribute of the markers using MARKERCOLORGROUP and MARKERSYMBOLGROUP.
In the process of making the graphs for this article I noticed the lack of a way to make the scatter markercharacter color by group, to match the color of the drug names to the line when using LINECOLORGROUP. There is no matching MARKERCOLORGROUP in the SCATTERPLOT. I will see what we can do about that. Please chime in with your comments and observations.
I certainly look forward to see the ways in which you can leverage these features.
Full SAS 9.4 Code: MultiGroup_94
Full SAS 9.3 Code: MultiGroup_93


7 Comments
How can we display the forest plot in the 2 pages , for example if we have 20 observations that will not fit in the one page. i want to display it in 2 pages and for subgroup column how can we display 10^9...
Finally had chance to use this in real life, but wanted to use it in a stepplot. My SAS 9.4M3 says this is a no go. Is this only seriesplot?
This is fantastic. We had a similar need when we wanted to show the group means from a trial and superimpose a few subjects. We wanted to match the subject patterns with the group they were in and it required a bit of programming. this is much nicer. thanks.
To answer Daniel's question, yes, the *GROUP options (LINEPATTERNGROUP, etc.) are available only on SERIES plot.
Thanks Dan. Not only surprising, but unfortunate. Surprising in that, with few exceptions, I'd expect features like this to carry over between step, series, etc. Unfortunate too as one could imagine the need to look at different treatment groups and how they behave with certain biomarkers. Maybe for M7.
Now I am also drawing a multi-group series plots, which is divided into gender and dose respectively. However, the drug I directly used for the variable group has not been drawn. After transformation, the value combined with gender and dose can be taken as group to realize this diagram.May I ask why this is?
Just to be sure I understand your situation correctly, can you tell me which variables are used on which option? (e.g. GROUP, LINECOLORGROUP, MARKERCOLORGROUP, etc.)