Often, the topic of an article is motivated by a question from a user. A satisfactory resolution of the situation is usually a good indication of a topic that may be of interest to other users. On such question was posed to me by a user this weekend. He wanted to display fit curves in a graph by group with the curve labeled all along its length by a one letter identifier.
 This seems like a useful way to label a curve, as sometimes placing a label at just the end of the curve can be less than optimal. When using a simple series plot, this is straightforward, and a short, one or two character label can be placed at intervals along the series.
But, what if the curves are fit plots, say a PBSpline or a regression? Now, the plotted data is not the same as the original data. Here is an example of curves of Mileage by Horsepower by Type. We have used DEGREE=3 just for illustration. The legend provides the decoding information, but it is less than ideal to refer back and forth to the legend. Click on the graph for a higher resolution image.
SAS 9.3 SGPLOT Code:
title 'Mileage by Horsepower and Type'; proc sgplot data=cars_type_label_hp; reg x=horsepower y=mpg_city / degree=3 nomarkers group=type name='s'; keylegend 's' / title=''; run; |
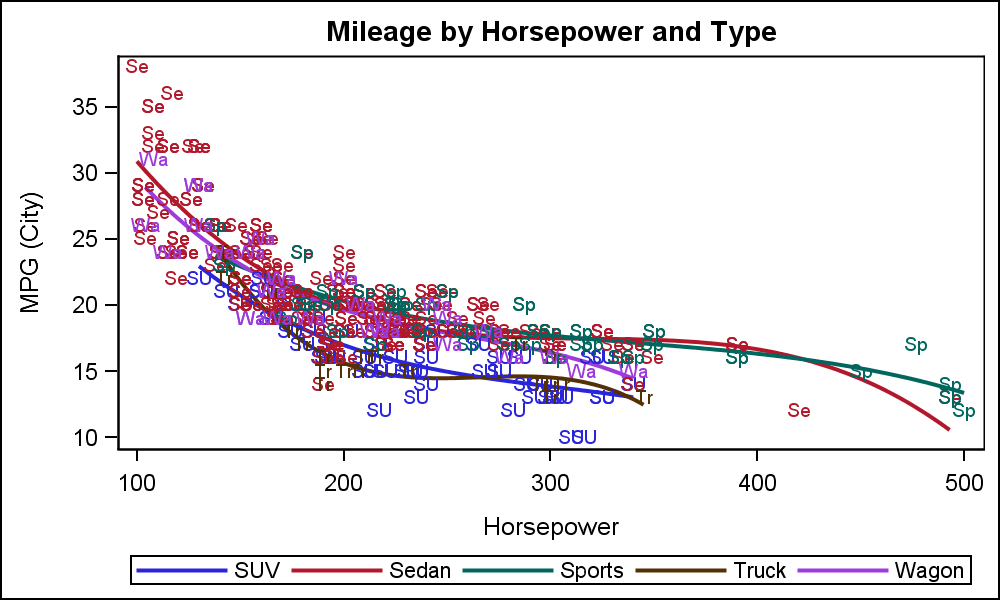
Now, we want to add a short code representing the vehicle type at equal intervals along the curves. First, we extract the label to be displayed as a 2 character abbreviation of the type. Now we use the Scatter plot with marker character option to display the short label at each observations:
SAS 9.3 SGPLOT Code:
title 'Mileage by Horsepower and Type'; proc sgplot data=cars_type_label_all_hp; reg x=horsepower y=mpg_city / degree=3 nomarkers group=type name='s'; scatter x=horsepower y=mpg_city / group=type markerchar=label; keylegend 's' / title=''; run; |
Clearly, this is not acceptable, as every original observation is labeled, creating a cloud of labels around each fit plot. What we need are the observations that are used to draw the fit curves, and not the original observations used to create the fit curves. Now, the points to draw the fit lines are internally generated by the procedure, and not directly available to us. How to do this?
To do this, we have to use a two-pass process. First, we run the SGPLOT procedure to draw the fit curves, and also request output of the generated data using the ODS OUTPUT data set as follows:
SAS 9.3 SGPLOT Code:
ods output sgplot=RegData; title 'Mileage by Horsepower and Type'; proc sgplot data=cars_type_label_all_hp; reg x=horsepower y=mpg_city / degree=3 nomarkers group=type name='s'; scatter x=horsepower y=mpg_city / group=type markerchar=label; keylegend 's' / title=''; run; |
Note the use of the statement ODS OUTPUT SGPLOT=RegData. This statement outputs the generated data to the data set name RegData. This data set has the generated fit data points in addition to the original data. The variable names are often long and convoluted. This is so the new generated names do not collide with the original column names, and are known to the renderer which generated columns to use to plot the data. Such as: "Regression_Horsepower_mpg_cit__x" and so on. See the generated data set for the generated variable names and values.
 For ease of use, we rename these generated column names to something simple like X, Y and Group. Now, we know the data used to plot the curves, so we can use this data to display the 2 character code along the curve. We ensure the data is sorted by Group and Horsepower, and create a 2 character code for every 30th observation. Then, we use the scatter plot with marker character to plot the labels.
SAS 9.3 SGPLOT Code:
title 'Mileage by Horsepower and Type'; proc sgplot data=RegCurves; reg x=x y=y / degree=3 nomarkers group=group name='s'; scatter x=x y=y / group=group markerchar=label2; keylegend 's' / title=''; run; |
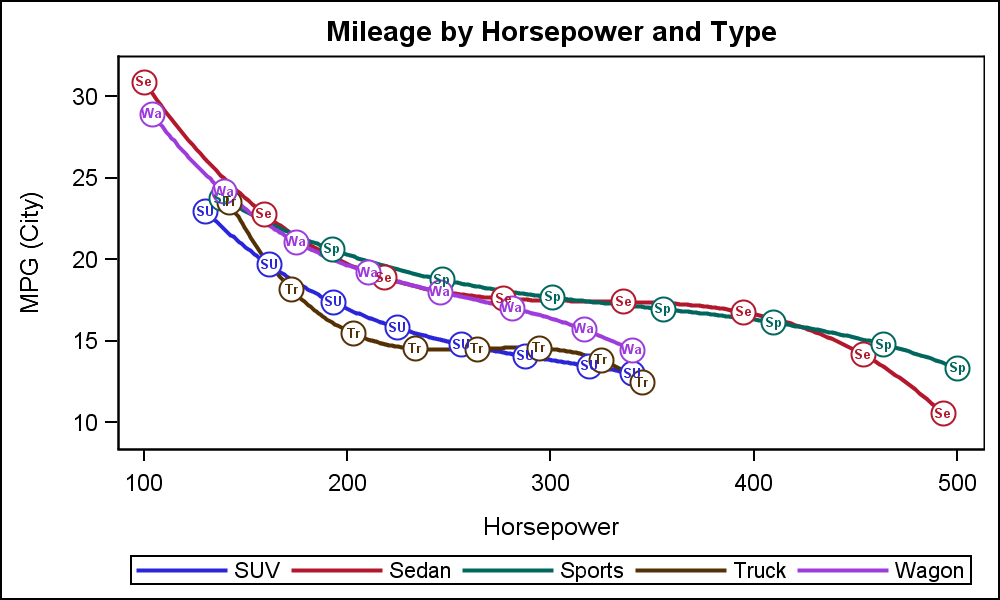 While we have achieved what the user wanted, but the overlaid curve labels look a bit cluttered. One way to improve the appearance would be to add small scatter markers at each location, and draw the label inside it, as shown below.
Now each abbreviated label is clearly visible, and the graph does not look cluttered.
SAS 9.3 SGPLOT Code:
title 'Mileage by Horsepower and Type'; proc sgplot data=RegCurves; reg x=x y=y / degree=3 nomarkers group=group name='s'; scatter x=x y=y2 / group=group markerattrs=(size=14 symbol=circlefilled) filledoutlinedmarkers markerfillattrs=(color=white); scatter x=x y=y2 / group=group markerchar=label2 markercharattrs=(size=5 weight=bold); keylegend 's' / title=''; run; |
Full SAS 9.3 SGPLOT code: CurveLabels


6 Comments
You can also use ODS OUTPUT to get to data that are contained in the ODS graphics produced by analytical procedures. For details and an example, see the article "How to get data values out of ODS graphics"
I think this post demonstrates a clear need for the graph procedures to support curve labels when the data is in a grouped univariate form, which is typically the form desired for most statistical analyses. In other words, if group=VAR is added to a plot statement, there should be an accompanying groupcurvelabel option to plot the labels next to their accompanying curves instead of as a separate legend (this groupcurvelabel option should duplicate the features provided by the curvelabel options extensions like position and location).
This features is already supported. As you have alluded to above, using CURVELABEL=GRP option on the SGPLOT SERIES statement will label each curve with the group value at the end of the curve. The exercise above was to label each curve INLINE along the plot itself as desired by a user.
Using your SeriesGroup dataset, I tried:
proc sgplot data = SeriesGroup;
series x = date y = value / group = Drug markers curvelabel ;
run;
And adding the curvelabel option without any arguments (it only accepts text strings as arguments, not variables) does indeed label each curve with the group variable's values. That's terrific!
The only problem is that this is not mentioned in its documentation:
----------
CURVELABEL <=“text-string”>
adds a label for the curve. You can also specify the label text. If you do not specify a label, the label from the Y variable is used.
-----------
Nowhere does it mention that if you do not specify the label text and the GROUP option is specified, then the values of the GROUP variable are used as the curve labels.
I think this is worth adding to the documentation.
You are right, the doc can be improved. I have forewarded your note to the doc folks.
Pingback: Multi-Group Series Plots - Graphically Speaking