Are you in the market for a new car? Perhaps you are researching how the various parameters of cars match up to each other? Well, in SAS 9.4 Maintenance 1 release, ODS Graphics will support a new versatile plot: the polygon plot. As the name suggests, it lets you draw polygons from data columns. Its similar to the drawPolygon capability in GTL and SG Annotations, except it is a nestable, full-blown plot. By now, Gentle Reader, you may be wondering if I have lost my mind: how are cars and polygon plot connected? Keep reading: I am still (relatively) sane!
Currently, we do not have a radar plot in ODS Graphics, but with some data transformations, we can stretch the polygon plot to do our bidding! Here is the basic idea:
- Normalize your variables of interest to [0..1].
- For each variable, compute polar coordinates along equidistant angles.
- Map the polar coordinates to Cartesian coordinates.
- Draw polygons using the coordinates.
For our adventure, I have used sashelp.cars as my data set. I have picked msrp, mpg_city, length, horsepower and weight as my variables of interest. To keep the graph readable I have selected the 12 most expensive cars going by their MSRP. Here is what the result looks like:
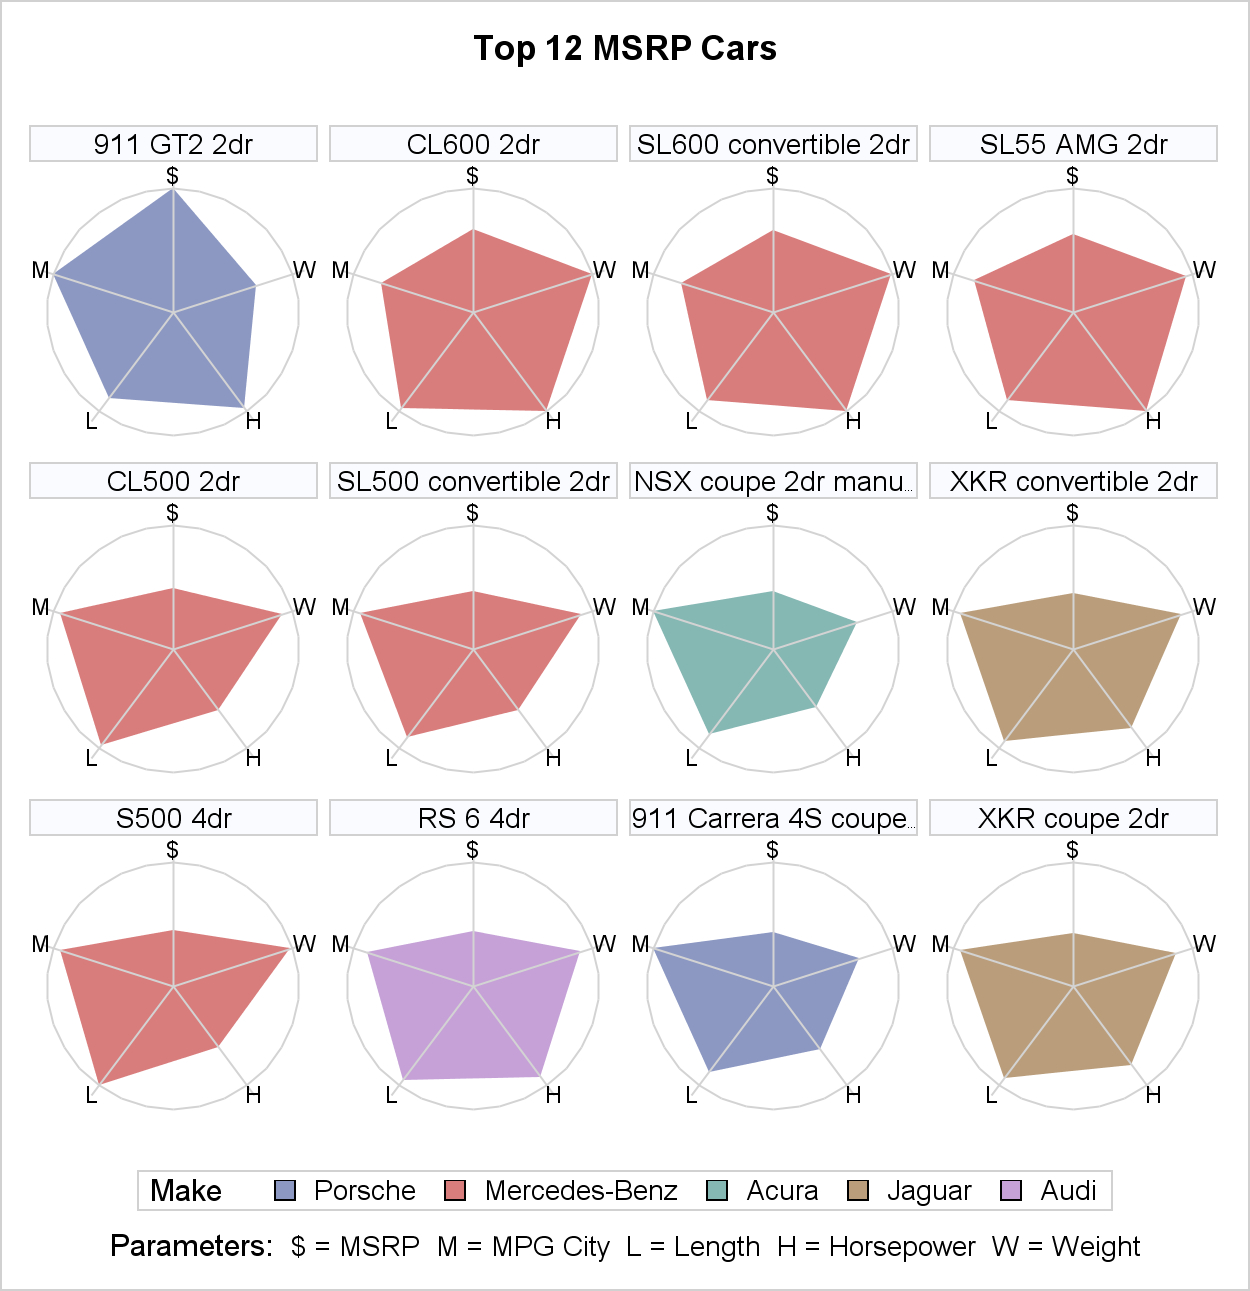
The radar polygons have been colored by the make variable and are arranged by decreasing MSRP, starting at top-left. To avoid clutter, the radar axes have been labeled by a single letter mnemonic with a footnote providing the details.
This graph can be created using the Graph Template Language (GTL) as well as the SGPANEL procedure. Below is a snippet from the SGPANEL implementation:
/* **REQUIRES SAS9.4 M1** */ proc sgpanel data=radarPoly aspect=1.0; title "Top 12 MSRP Cars"; panelBy model / columns=4 sort=data noVarName spacing=4 noBorder; colAxis display=none alternate; /* Hide all axes */ rowAxis display=none alternate; polygon id=model x=rdX y=rdY / group=make fill ... /* Radar */; polygon id=model x=maxGridX y=maxGridY / ... /* Outermost grid */ vector x=radAxisX y=radAxisY / xOrigin=0 yOrigin=0 noArrowHeads ... ; /* Axes */ scatter x=radAxisX y=radAxisY / markerChar=radAxisLabel; /* Axis labels */ footnote "Parameters: " height=9pt " $ = MSRP M = MPG City L = Length ... "; run; |
Full SAS 9.4 M1 code: Radar panel plot for car parameters using SGPANEL
Psst! Did you notice the aspect=1.0 option on the SGPANEL statement? That ensures that the individual cells in the panel have a square aspect ratio.
While this graph may not be the ideal for making exact comparisons like you could with a clustered bar chart, we can very quickly make similar / dissimilar comparisons. For example, Acura's NSX Coupe looks very similar to Porsche's 911 Carrera 4S coupe, where as Porsche's 911 GT2 and 911 Carrera 4S coupe models look quite different. So if you are looking for a group of characteristics to fit a particular 'shape' in your quest for the perfect car, the radar panel works well!
In this visual, the [0, maximum] for each parameter has been mapped to [0, 1] on its radar axis. One can also think of mapping the [minimum, maximum] of each parameter to [0, 1] to accentuate the relative differences between these sets of values. That graph is left as an exercise to the reader!
Now, you might say "SAS 9.4M1 is fine and dandy, but can I do this today with latest and greatest SAS 9.4? " . Well, you can do a modified version! We can change our data transformation slightly to repeat the first observation used to draw each polygon. With this change, we can use series plots to draw the radar outlines - no fills though. Here is the SAS 9.4 version of this graph:
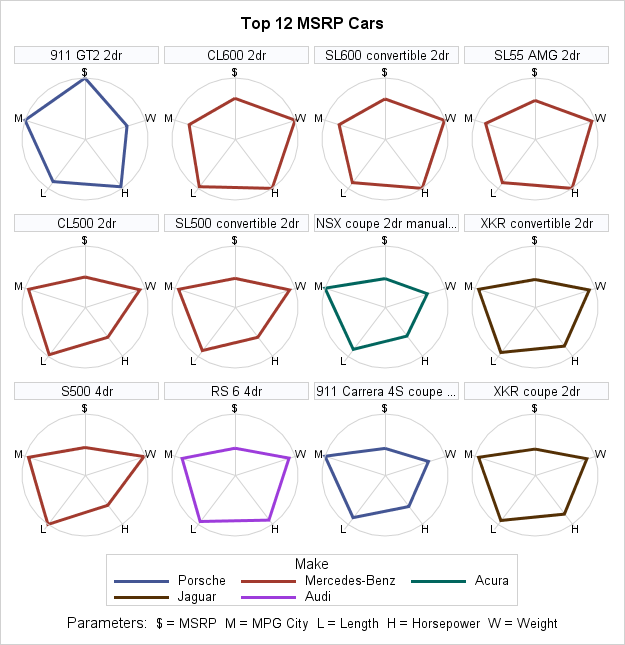
Full SAS 9.4 code: Radar Panel using Series and SGPANEL
Last, but not the least, Happy Thanksgiving!


1 Comment
Great post. Glad to see this feature added. Thanks!