A couple of weeks back we had a question on how to make a bar chart with stacked and clustered groups. User also wanted to display the value for each stacked segment below the bars. The article Bar Charts with Stacked and Cluster Groups shows how to create such a graph.
Along the way, we have also been getting many requests to create bar charts with stacked groups, where each segment in the stack is labeled by the value of the segment. At this time, such a graph cannot be made by just setting some option. We do have a request in the works to add this feature. In the meantime, what can you do?
Here is how you can create stacked bar charts with various levels of labels, starting with the basic stacked bar chart:
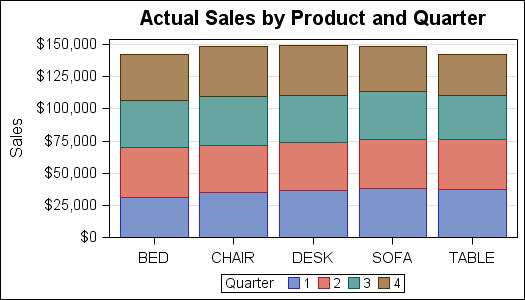
SGPLOT code for stacked bar chart:
proc sgplot data=sashelp.prdsale; title 'Actual Sales by Product and Quarter'; vbar product / response=actual group=quarter stat=sum; xaxis display=(nolabel); yaxis grid label='Sales'; run; |
Now, we can add bar labels to each by simply adding the DATALABEL option on the VBAR statement.
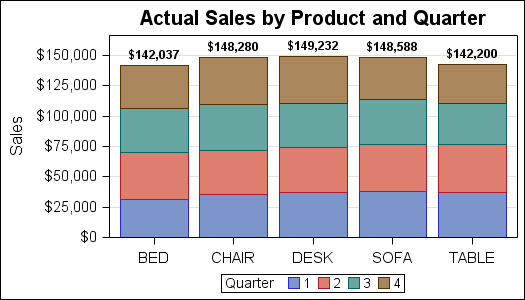
SGPLOT code for stacked bar chart with labels:
proc sgplot data=sashelp.prdsale; format actual dollar6.0; title 'Actual Sales by Product and Quarter'; vbar product / response=actual group=quarter stat=sum datalabel datalabelattrs=(weight=bold); xaxis display=(nolabel); yaxis grid label='Sales'; run; |
In the above graph, we have used a bold font for the data labels on the top of each bar. Note, only one label showing the total summarized value of each bar is drawn. Individual segment are not labeled to avoid clutter.
In certain cases, you may specifically want to label each segment of the stacked bar, and you are not concerned about clutter. At this time, there is no simple option you can set to create such a bar chart using the SGPLOT procedure.
However, there is a way to do this by pre-summarizing the data by category and group, computing the location of each segment incrementally per category. Then draw the bar segments and labels. Yes, it is a bit like annotate, but not hard. Here is the graph:

The steps needed to get this graph are:
- Summarize the data by category and group variable using the MEANS procedure.
- Use a data step to compute the low and high value for each bar segment as if it was stacked.
- Draw the bar segments using the HIGHLOW statement.
- Draw the segment labels using the SCATTER statement.
The full code to create the data set using the proc means step and the data step are shown in the code attached at the bottom. In the data set, we compute the low, mid and high value for each segment by product by stacking each group value. The "mid" value is the mean, to draw the label. The HighLabel column is the high value for the highest segment only. This is set to missing for other segments. Here is the SGPLOT code to draw the graph:
SGPLOT code for stacked bar chart with segment labels:
proc sgplot data=HighLow; title 'Actual Sales by Product and Quarter'; highlow x=product low=low high=high / group=quarter type=bar lineattrs=(pattern=solid); scatter x=product y=mid / markerchar=actualsum; xaxis display=(nolabel); yaxis grid offsetmin=0 label='Sales'; run; |
Now, if we want both segment labels and the top label, we draw the HighLabel value using the HighLabel option. Since only the highest segment has a non missing HighLabel value, only one final value is drawn. We made this bold.
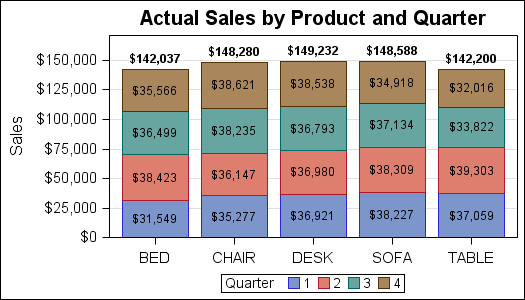
SGPLOT code for stacked bar chart with segment and top labels:
proc sgplot data=HighLow; title 'Actual Sales by Product and Quarter'; highlow x=product low=low high=high / group=quarter type=bar lineattrs=(pattern=solid) highlabel=highlabel labelattrs=(weight=bold); scatter x=product y=mid / markerchar=actualsum; xaxis display=(nolabel); yaxis grid offsetmin=0 label='Sales'; run; |
Full SAS 9.3 SGPLOT code: Stacked_Bar_Labels


11 Comments
Hi,
I used you code to obtain a stacked bar chart like the one with the Actual Sales by Product and Quarter, with the SGPLOT code for stacked bar chart with segment and top labels. (your last example on the bottom of the page).
Now I want to ORDER these results, e.g. : the sales figures for BED should appear in the stacked bar starting with the lowest figure at the bottom ($31 549), then the second lowest ($35 566), then the third lowest ($36 499), ending with the highest figure on top of the stack ($38 423).
I tried a groupsort statement, and a proc sort on the HighLow dataset, though did not succeed.
Is there a simple way to get these figures sorted?
Thx in advance!
Herman
How does one show the segment labels for a 100% stacked bar chart?
I am creating a Grouped/Stacked Vertical bar using data imported from a spreadsheet. The spreadsheet has the data sorted as I want it in the chart, any ideas on how to accomplish this. The data I would like to sort by is the names of months and I of course want them in Jan, Feb, Mar etc... order.
Thank you
http://blogs.sas.com/content/graphicallyspeaking/2013/09/07/bar-charts-with-stacked-and-cluster-groups/
Hello. I have a question regarding stacked bar charts in proc sgplot: how can I change the color of each group in a bar? In your example, the four colors are blue,red, green, and brown. If I want to change these colors to different colors, what should I do?
Thank you very much.
Khoi
With SAS 9.4, this is very easy. Just use the STYLEATTRS statement in the SG procedures, and specify the colors in the DATACOLORS and DATACONTRASTCOLORS list. The colors specified will be used as group colors instead of the colors in the active style.
In SAS 9.2, there is no option datalabelattrs, so how can I display the sum of sales in each of the
The DataLabel option is available with SAS 9.2.
SAS 9.4 now allows you to label segment labels within SGPLOT using the statement SEGLABEL.
Documentation/code available here: http://support.sas.com/kb/55/866.html
Sample code:
proc sgplot data=sashelp.prdsale;
vbar product / group=country response=actual seglabel seglabelattrs=(size=12);
run;
Is there any way to have different color text for the segment labels? Now I can say seglabelattrs=(color=blue) and get blue text. I would like more than one color such as seglabelattrs=(color=blue red green). This does not work, so is there any way to change this using SGPLOT options or a style template option?
Unfortunately, no. You can change the color of the text, but all segment labels will get that color.
One way to get around this is to compute your own locations for the segment labels, then draw them using the TEXT statement. Now, you can use a GROUP option to change each color.