A parametric bar chart in SG Procedure and GTL parlance is a simplified version of the regular bar chart, where the data is assumed to be summarized prior to its usage inside the SG procedures or GTL. So, multiple occurrences of the same category and / or group combination is not expected. If this does occur, multiple "bar" elements are overdrawn in the same location.
The benefits of this are many, especially with the SG procedures, where the VBAR statement is very useful as it summarizes the data when multiple observations are encountered for the classifiers. But this also restricts the ways in which it can be used in combination with other plot statements. A VBAR statement can only be combined with other VBAR or VLINE that have exactly the same combination of category and group variables. The same applies to the HBAR statement.
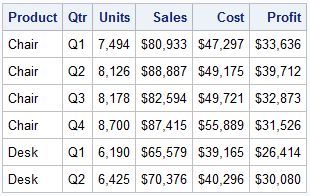
Let us use the data shown below for Sales, Cost, Profits and Units Sold by Product and Qtr. The data set has multiple observations, one for each combination of Product and Qtr.
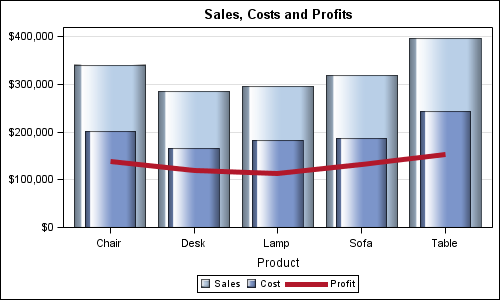
Here is a bar chart of Sales, Cost and Profit by Product. The VBAR and VLINE statements are used, which will summarize the data for each product.
SAS 9.3 SGPLOT code:
proc sgplot data=revenue; vbar product / response=sales dataskin=gloss nostatlabel fillattrs=graphdatadefault; vbar product / response=cost dataskin=gloss nostatlabel barwidth=0.6 fillattrs=graphdata1; vline product / response=profit nostatlabel lineattrs=graphdata2(thickness=5 pattern=solid); yaxis offsetmin=0 display=(nolabel) grid; run; |
The VBAR and VLINE statements summarize the data by Product, so the multiple observations for each quarter are handled by the statement.
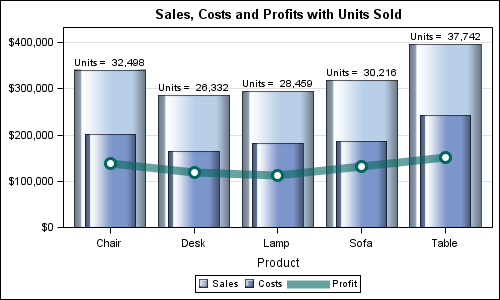
If you want to be creative in the way the data is represented as bars, lines and markers, etc., you cannot use the VBAR statement as it does not allow combinations with basic plot statements like scatter. However, you can use the VBARPARM statement, as long as you summarize the data yourself using the MEANS procedure or in some other way. Once summarized, this same data can be represented more creatively using the VBARPARM statement.
This graph shows the information as a Bar Chart and Series Plot with Outlined Markers. Bar Label display the Units Shipped at the top of each bar:
SAS 9.3 SGPLOT code:
/*--Summarize the data using Proc MEANS--*/ proc means data=Revenue sum noprint; class product; var Sales Cost Profit; output out=revenueSum sum(Sales Cost Profit Units) = Sales_sum Cost_sum Profit_sum Units_sum; run; /*--Build the label for Units Shipped--*/ data revenueSum2; label sales_sum='Sales' cost_sum='Costs' profit_sum='Profit' units_sum='Units'; set revenueSum(where=(_type_ eq 1)) end=last; retain ymax 0; UnitLabel=cat('Units =', put(units_sum, comma8.0)); ymax=max(ymax, sales_sum); if last then call symput("YMAX", ymax); run; /*--Create graph--*/ proc sgplot data=revenueSum2; title 'Sales, Costs and Profits with Units Sold'; vbarparm category=product response=sales_sum / dataskin=gloss datalabel=UnitLabel datalabelattrs=(size=8) fillattrs=graphdatadefault name='s'; vbarparm category=product response=cost_sum / dataskin=gloss barwidth=0.6 fillattrs=graphdata1 name='c'; series x=product y=profit_sum / lineattrs=graphdata3(thickness=9 pattern=solid) transparency=0.4 name='p'; scatter x=product y=profit_sum / markerattrs=graphdata3(size=15 symbol=circlefilled); scatter x=product y=profit_sum / markerattrs=(size=9 symbol=circlefilled color=white); yaxis offsetmin=0 display=(nolabel) grid values=(0 to 400000 by 100000); keylegend 's' 'c' 'p'; run; |
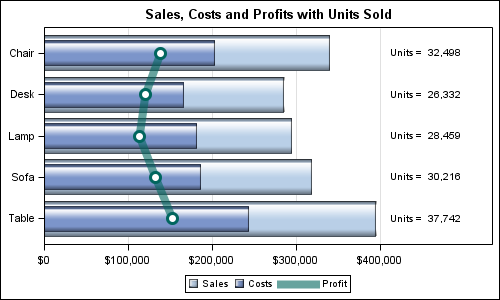
Once the data is summarized, you can use any combination of the parametric bar statement with other basic plots to create the graph. Here is the same data displayed as a horizontal bar chart. The units shipped are shown at the right side of the graph using the SCATTER statement. The code is included in the file attached at the bottom:
In the graph below, we show the same data, this time showing the Units Shipped as another series plot mapped to the Y2 axis on the right hand side. The color of the series plot and the Y2 axis are made the same to reinforce the association. The code is included in the file attached at the bottom:
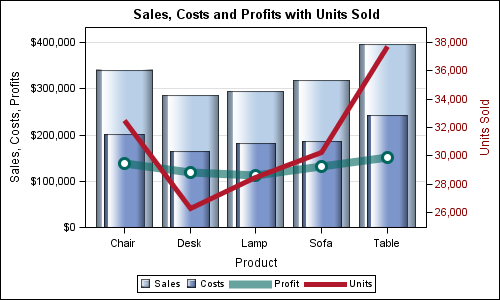
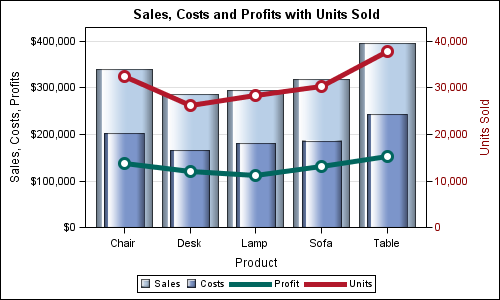
Note, the axis scaling for the Y (left) and Y2 (right) axis are independent of each other. The Y axis has bar charts associated with it, and hence has a baseline of zero. This is not the case for the Y2 axis. However, it would be nice to set the values for the Y2 axis such that it does have the same zero baseline, and the tick values match the grid lines. We can do that by setting the VALUES option appropriately. The new graph is shown below and the code is included in the SAS program file attached below.
Conclusion: If you summarize your data yourself by the required classifiers yourself, you can use the VBARPARM and HBARPARM in combination with all basic plot statements to build creative displays of your data.
Full SAS 9.3 Code: VBarParm


3 Comments
Hi Sanjay
Thanks for these great examples. The difference between VBAR and VBARPARM is very well illustrated. As your examples show, opens up new possibilities.
Bruno
Thanks for this creative use of the Vbarparm procedure. Recently I've been asked to come up with showing new ways of presenting our "same old" data, and this is definitely a brilliant possibility!
this one is really good. thanks!