Forest plots come in many flavors. An example of a Forest plot using GTL is available on the SAS support web site. Simple forest plots can also be created using SGPLOT procedure by using the SCATTER statement with MARKERCHAR to display data aligned with the plot by study names.
One issue that has come up is the need to display the studies by subgroup. In this case the study values are grouped by categories, with the study names being indented so show the grouping as seen in the data below.
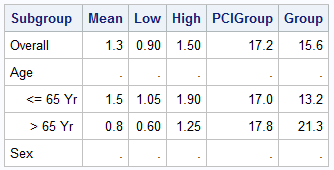
The study names for the age groups are indented using leading spaces to indicate the grouping. Here is the graph of this using SGPLOT procedure. Click on graph for bigger version.
SGPLOT Code:
proc sgplot data=forest noautolegend; refline 1.0 / axis=x; scatter y=subgroup x=mean / xerrorlower=low xerrorupper=high markerattrs=(symbol=circlefilled); scatter y=subgroup x=pci_lbl / markerchar=pcigroup x2axis; scatter y=subgroup x=grp_lbl / markerchar=group x2axis; xaxis display=(nolabel noticks) offsetmin=0.5 values=(0 to 2 by 0.5) valueattrs=(size=6); x2axis display=(nolabel noticks) offsetmax=0.7 valueattrs=(size=6); yaxis reverse display=(noticks nolabel) valueattrs=(size=6); run; |
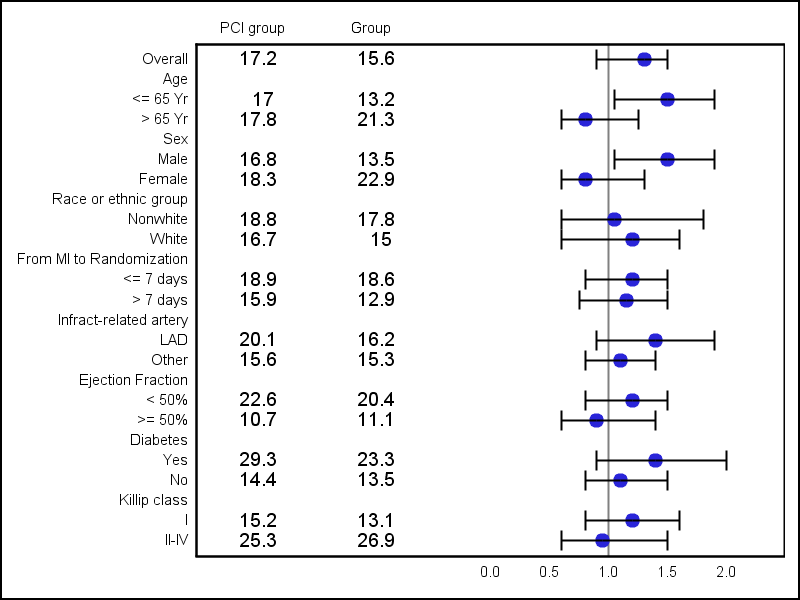
In the graph above, we have used the subgroup variable as the Y axis role. As we can see, the graph strips the leading and trailing blanks for the Y axis tick values, and the indentations are lost.
Instead of using the Y axis for the study names, we can use the Scatter plot MarkerChar option to display the subgroups, just like we do for the values. However, here too, the leading and trailing blanks are stripped, and the remaining text is center justified, so again the indentations are lost.
Non-Breaking Space to the rescue. Known in the html world as nbsp (xA0), a non-breaking space is like a regular white space (blank), except that a sentence does not break at such a space in an html page. For us, it means that leading and trailing nbsp spaces are not stripped, thus retaining the indentation in the original text. Also, to properly line up the text, we will need to use a fixed width or non-proportional font to display this text.
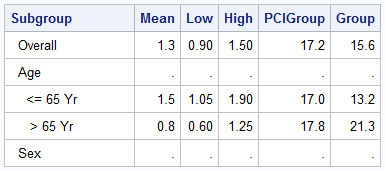
Here is the same data using nbsp for the blanks in the Subgroup variable. Note, nbsp are used for both the leading and trailing blanks and are preserved by the proc print output.
Here is the graph using the SGPLOT procedure:

SGPLOT Code:
proc sgplot data=forest_nbsp noautolegend; refline idref / axis=y lineattrs=(thickness=9 color=cxf0f0f0); refline 1.0 / axis=x; scatter y=id x=mean / xerrorlower=low xerrorupper=high markerattrs=(symbol=circlefilled); scatter y=id x=sub_lbl / markerchar=subgroup x2axis markercharattrs=(family=&font weight=bold); scatter y=id x=pci_lbl / markerchar=pcigroup x2axis; scatter y=id x=grp_lbl / markerchar=group x2axis; xaxis display=(nolabel noticks) offsetmin=0.6 values=(0 to 2 by 0.5) valueattrs=(size=7); x2axis display=(nolabel noticks) offsetmax=0.5 valueattrs=(size=7); yaxis reverse display=none; run; |
In the graph above, we have used the following features:
- The Subgroup variable has text with nbsp for leading and trailing blanks.
- The'xA0'character was copied from the Windows Character Map tool.
- The MarkerChar option of the Scatter plot is used to draw the Subgroup values.
- The font is set to a fix width font face.
- The Y axis is suppressed.
- Alternating grey bands are used to help the eye across the data.
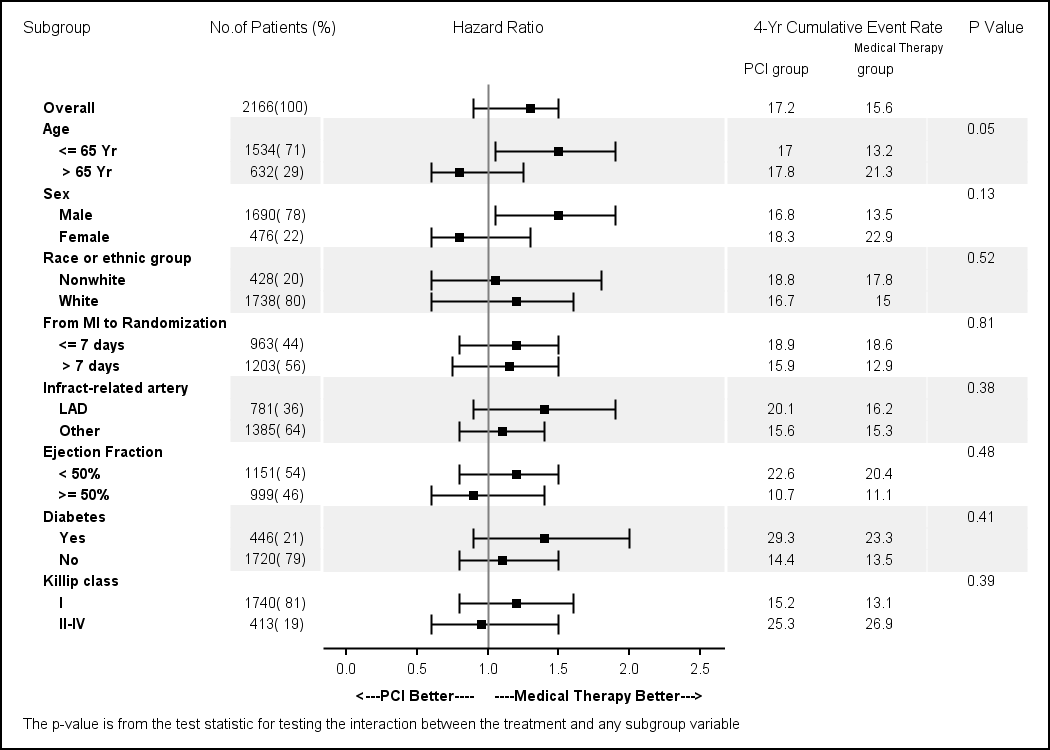
When using SGPLOT to create this graph, all the values displayed using the MarkerChar option are on one side and the graph is on the other. But this example is for illustration purposes of the usage of nbsp. For a graph with better formatting, you can also use GTL as shown below.
I am working on this example for CTSPedia using SAS 9.2(TS2M3). Once finalized, I will post the code.
Full SAS Code: NBSP_Code


8 Comments
Do you have SAS code for the last forest plot? Thanks
Pingback: Doing more with nbsp - Graphically Speaking
Pingback: Forest Plot with Subgroups - Graphically Speaking
Hi Sanjay,
I am trying to use your code. I having error in log for options VALUEATTRS and REVERSE at XAXIS and YAXIS statements. We have SAS92 TS level 2M3. Could you please help me what could causing this error?
Here is log :
121 xaxis display=(nolabel noticks) offsetmin=0.5 values=(0 to 2 by 0.5) valueattrs=(size=6);
---------- ----
1 22
202
122 x2axis display=(nolabel noticks) offsetmax=0.7 valueattrs=(size=6);
---------- ----
1 22
202
WARNING 1-322: Assuming the symbol VALUES was misspelled as valueattrs.
ERROR 22-322: Syntax error, expecting one of the following: a numeric constant, a datetime constant, (.
ERROR 202-322: The option or parameter is not recognized and will be ignored.
123 yaxis reverse display=(noticks nolabel) valueattrs=(size=6);
------- ---------- ----
22 1 202
202
ERROR 22-322: Syntax error, expecting one of the following: ;, DISCRETEORDER, DISPLAY, FITPOLICY, GRID, INTEGER, INTERVAL,
LABEL, LOGBASE, LOGSTYLE, MAX, MIN, MINOR, NOTIMESPLIT, OFFSETMAX, OFFSETMIN, REFTICKS, TICKVALUEFORMAT, TYPE,
VALUES, VALUESHINT.
WARNING 1-322: Assuming the symbol VALUES was misspelled as valueattrs.
ERROR 202-322: The option or parameter is not recognized and will be ignored.
123! yaxis reverse display=(noticks nolabel) valueattrs=(size=6);
----
22
ERROR 22-322: Syntax error, expecting one of the following: a numeric constant, a datetime constant, (.
124 run;
NOTE: The SAS System stopped processing this step because of errors.
NOTE: PROCEDURE SGPLOT used (Total process time):
real time 0.01 seconds
cpu time 0.01 seconds
I don't have access to SAS 9.2(TS2M3) at this time. Check your doc for xaxis or yaxis. It would appear that REVERSE and VALUEATTRS are not supported at SAS 9.2 (TS2M3). You can get around that by sorting your data and removing those two options from you code.
Hi Sanjay,
It is confirmed that these options are available in 9.3 only. I have tried to use DISCRETEORDER=data option for Y-axis to display values as they appear.
But didn't able to get desire output.
Pingback: Ways to include textual data columns in graphs - Graphically Speaking
Hi Sanjay,
Thank you for such a useful information about forest plot. I want to create the same forest (sub group) plot using annotation option in proc gplot, Is it possible to create the same through Gplot?