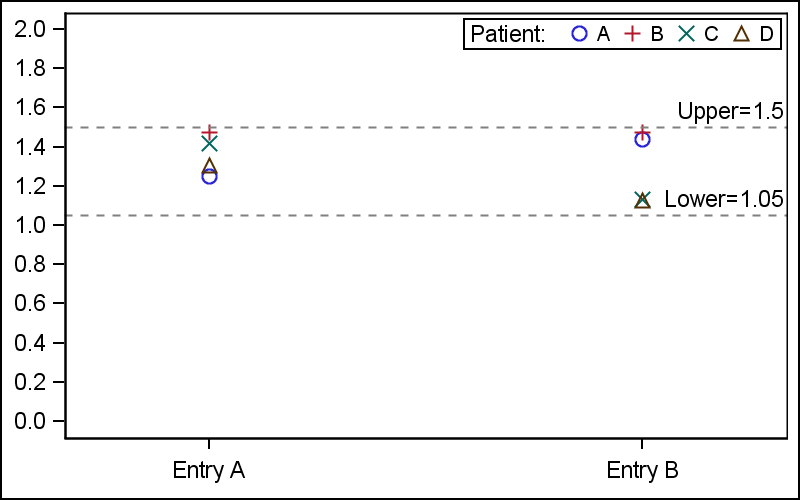
In the Clinical Research domain, there is often the need to display lab values by treatment or test and it is often useful to view this data along with reference lines showing the normal ranges. The obvious way is to use reference lines to denote the normal ranges.
SGPLOT Code:
proc sgplot data=band; scatter x=x y=y / group=group markerattrs=(size=9) name='a'; refline 1.05 1.5 / lineattrs=(pattern=shortdash) label=("Lower=1.05" "Upper=1.5") labelloc=inside; yaxis values=(0 to 2 by 0.2) display=(nolabel); xaxis offsetmin=0.2 offsetmax=0.2 display=(nolabel); keylegend 'a' / title='Patient:' location=inside position=topright; run; |
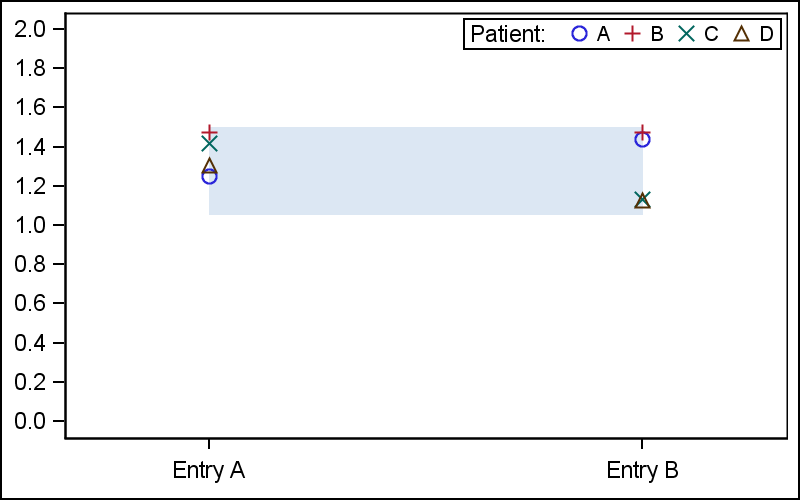
Another way would be to use a band plot with constant upper and lower values to draw the normal ranges:
SGPLOT Code:
proc sgplot data=band; band x=x upper=1.5 lower=1.05 / transparency=0.5; scatter x=x y=y / group=group markerattrs=(size=9) name='a'; yaxis values=(0 to 2 by 0.2) display=(nolabel); xaxis offsetmin=0.2 offsetmax=0.2 display=(nolabel); keylegend 'a' / title='Patient:' location=inside position=topright; run; |
A user recently did this, and noticed that something was amiss in the graph above. The bands do not extend to the edges of the graph, even though the default setting is EXTEND and the band has constant upper and lower limits.
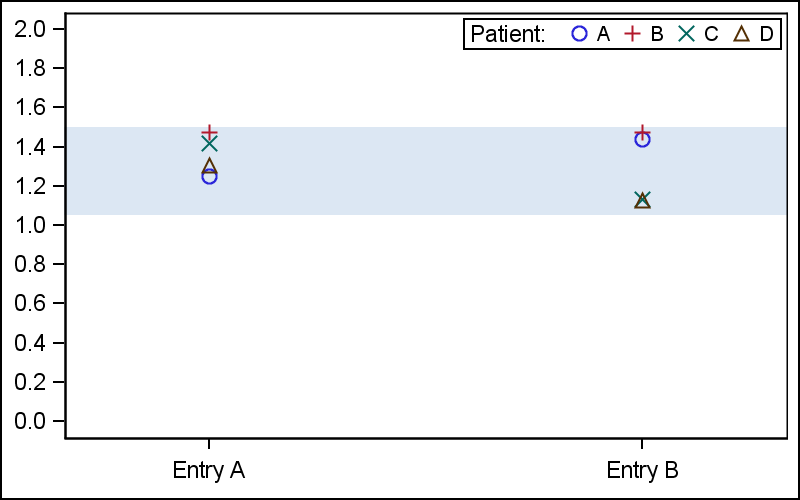
Well, it turns out that the Band plot only supports extending the band to the edge of the graph if the band variable (X in this case) is numeric. So, the work around is to use a numeric X axis, along with a UDF to get the right tick values:
SGPLOT Code:
proc sgplot data=bandNum; band x=x upper=1.5 lower=1.05 / transparency=0.5; scatter x=x y=y / group=group markerattrs=(size=9) name='a'; yaxis values=(0 to 2 by 0.2) display=(nolabel); xaxis offsetmin=0.2 offsetmax=0.2 display=(nolabel) values=(1 2); keylegend 'a' / title='Patient:' location=inside position=topright; run; |
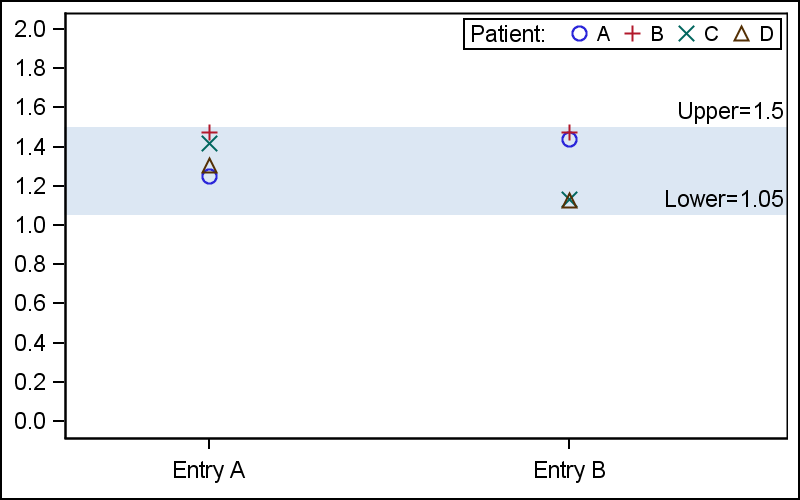
Add Range values: We can add upper and lower curve labels to the band to display the upper and lower ranges. However, it seems that defeats the extend feature. So, another work around is needed and we can overlay reference lines with labels for the display of the values along with the band plot.
SGPLOT Code:
proc sgplot data=bandNum; band x=x upper=1.5 lower=1.05 / transparency=0.5; refline 1.05 1.5 / lineattrs=(pattern=shortdash thickness=0) label=("Lower=1.05" "Upper=1.5") labelloc=inside; scatter x=x y=y / group=group markerattrs=(size=9) name='a'; yaxis values=(0 to 2 by 0.2) display=(nolabel); xaxis offsetmin=0.2 offsetmax=0.3 display=(nolabel) values=(1 2); keylegend 'a' / title='Patient:' location=inside position=topright; run; |
Full SAS program: Band_Code


