PharmaSUG 2012 conference drew to a close today, concluding two and a half days packed with papers, presentations, posters, hands-on demos and super demos by SAS staff. While the weather outside was a bit chilly from time to time, the conference what hopping with many user papers on how to use graph procedures to create innovative graphs.
It was good to see that a large majority of users have now moved to SAS 9.2 or later release, with over 25% using SAS 9.3. ODS Graphics, SG Procedures, GTL and Desigener are now mainstream. Some interesting items were as follows:
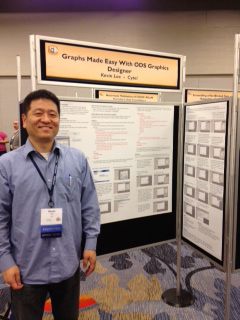
Poster on Designer wins 1st prize. Kevin Lee of Cytel presented a poster titled "Graphs Made Easy with ODS Graphics Designer". He showed ways to create graphs with Designer, where he created the graphs interactively, and then included the GTL code generated by Designer as part of the documented process.
Personalized Risk Graphs using KPI: Janet Gruber investigated the usage of different KPI graphs to visualize individual risk of developing Type-2 Diabetes. Clinicians preferred the usage of vertical thermometer KPIs. Janet and her team created their KPI graphs using the GKPI procedure. See my article on Dashboard Graphs using using GTL.
Water Fall Charts for Oncology Trials: Niraj Pandya shows how to use waterfall charts to plot tumor sizes. This graph was created using SGPLOT VBAR statement, with innovative usage of an overlaid VLINE statement to add annotations (marker shapes) to the top of some of the observations.
Dr. Mat Soukup and Dr. Stephen Wilson of FDA presented the opening session keynote address on "Doing IT Better". Mat stressed the view that graphical presentation of the voluminous data was key to easier understanding of the findings by the reviewers. Mat has been involved in a project to define a set of graphs suitable for the analysis of safety data, and these graphs are available on the CTS repository website. It is good to see that many graphs created using ODS Graphics shown on the SAS Support Clinical Graphs web page are included here.
Patient Profile Graphs: There was keen interest by the audience in Patient Profile graphs, Forest Plots, Adverse Event Graphs and more. I forwarded copies of Dan O'Connor's Patient Profile Macro to quite a few users.
I presented a 1/2 day seminar on Clinical Graphs using SG Procedures that was well attended. The audience was very animated, with lots of questions. The Super Demos on Clinical Graphs, SG Procedures, GTL and Designer were very popular.


