The dimensions of your graph can affect the aspect ratio, which in turn, can subtly affect the perception of your viewers. When visual perception is of prime importance, the aspect ratio of the graph needs to be adjusted with care. This technique is known as ‘banking’, was introduced by William Cleveland.
Starting with SAS 9.2 (TS2M3), GTL supports the ASPECTRATIO option on a LAYOUT OVERLAY. This lets you control the ratio of height to the width (height/width) of the plot wall area. This may be the inverse of what you are used to (aspect ratio as width/height).
Shown below are two graphs with identical data. The blue line is a line parm with a slope of 1. The top graph is using the default aspect ratio. Here the line parm does not visually appear to be at a 45 degree orientation because the data scales of the two axes are different. In certain cases, it may be important to your viewers that a line segment with a slope of 1 be perceived as being at a 45 degree orientation. Iterating over different values of aspect ratio, we find that a value of 3.8 comes pretty close, as shown in the bottom graph.
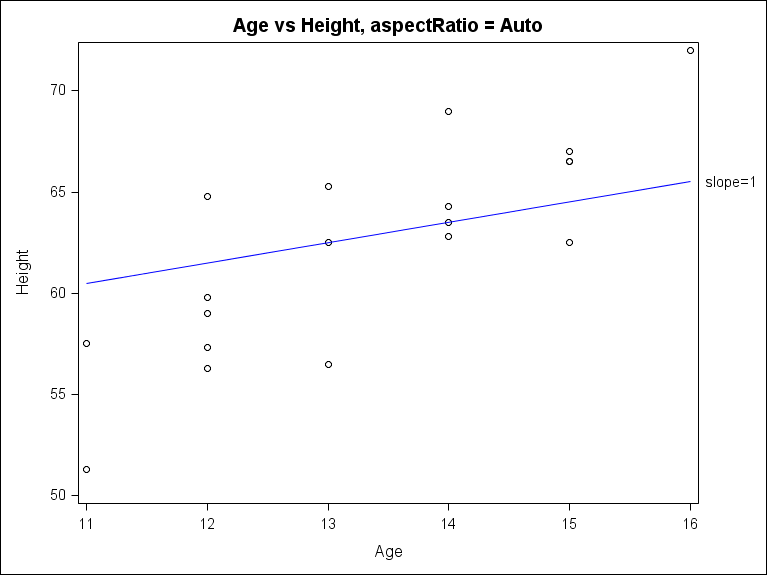

Here is the code for these graphs. You can set the dynAspect dynamic to ‘auto’ for the top one. Setting it to 3.8 gives you the bottom graph. We could improve this simple example by reducing the graph design width to reduce the excess dead area on the sides of the wall.
proc template; define statgraph aspect1; dynamic dynAspect "Aspect Ratio"; begingraph; entrytitle 'Age vs Height, aspectRatio = ' dynAspect; layout overlay / aspectRatio=dynAspect; scatterplot x=age y=height; lineParm x=13 y=62.5 slope=1 / lineAttrs=(color=blue) curveLabel="slope=1" curveLabelLocation=outside; endlayout; endgraph; end; run; proc sgrender data=sashelp.class template=aspect1; dynamic dynAspect=’Auto’; /* dynAspect=3.8 */ run; |
Note that the default aspect ratio depends on the effective height and width of your graph. It can also be influenced by titles, footnotes and legends outside the wall area. So you could certainly play with these to get the desired aspect ratio, but setting an explicit value guarantees the plot wall is rendered with that aspect ratio.
In the above example, we are only attempting to make the visual or rendrered slope of the line close to 1 using the ASPECTRATIO option on the overlay layout. If instead, we wanted to force the slope to 1 in data coordinate space as well as the visual rendered space, we would use the LAYOUT OVERLAYEQUATED container. The overlayEquated layout is a specialized overlay layout which ensures an equal data scale for its two axes. A line of slope 1 will be drawn at 45 degrees in this layout. However, this layout only supports linear numeric axes.
When creating series plots, time series or sparklines to show trends, a lot of research has been done on the ideal aspect ratio to use [See Heer and Agrawala, Multi-Scale Banking to 45 Degrees]. The general consensus seems to be that an aspect ratio that keeps the line segments around 45 degrees going up (or -45 degrees going down) is the best for detecting trends.
In Heer and Agrawala, several algorithms for the best aspect ratio are discussed. Some of them are simple to compute, while the more complex ones need to be solved as optimization functions or need Fourier analysis.
One of the simpler methods to compute in the Heer and Agrawala paper comes from Cleveland and is called ‘Median Absolute Slope’ banking. Below are two graphs using the air travel sample dataset (sashelp.air). The top graph is using the default aspect ratio and the bottom one is using the aspect ratio as per the Mean Absolute Slope algorithm.
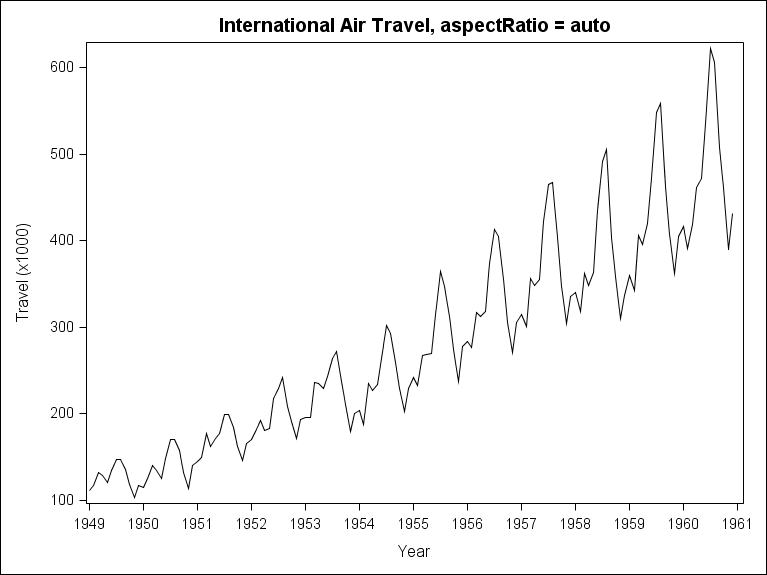
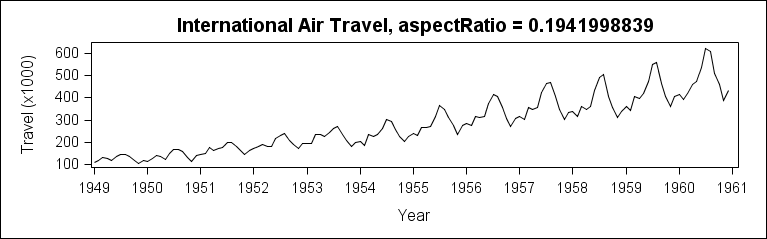
As you can see, the rate of increase in air travel looks less strident in the bottom graph. Which one you should use may depend on the story you want to tell! Note that the DESIGNHEIGHT for the bottom graph has been adjusted to reduce dead space. The full code for the bottom graph is here: Median Absolute Slope Aspect Ratio.
ASPECTRATIO is also supported on the LAYOUT PROTOTYPE statement for use in data lattice and data panel layouts. This ensures that you get the specified aspect ratio for every cell in these multi-celled layouts.
So if you want to guide your viewers’ perception just the way a highway’s banked curves aid a vehicle, go ahead and use aspect ratio!


1 Comment
Pingback: Banking to 45 degrees: Aspect ratios for time series plots