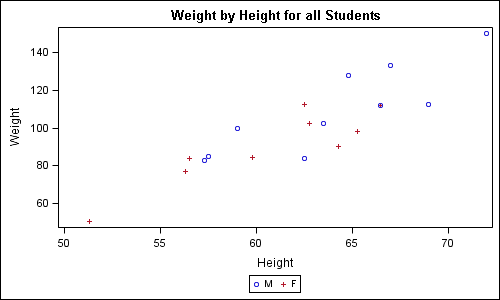
Rick Wicklin's blog post on using abbreviations provided a solution for a long standing pain. When writing a new GTL program for simple graph, often the bulk of the code is boiler plate. To create a simple scatter plot of weight by height, you need to type in the following program:
proc template; define statgraph class; begingraph; entrytitle 'Weight by Height for all Students'; layout overlay; scatterplot x=height y=weight / group=sex name='a'; discretelegend 'a'; endlayout; endgraph; end; run; ods listing; ods graphics / reset width=5in height=3in imagename='class'; proc sgrender data=sashelp.class template=class; run; |
As you can see in the code above, of the 15 lines only a few lines of code need unique settings to create the graph. The other lines are boiler plate that you can customize later (after you have seen a graph).
My simple minded solution to this was to save a SAS file with this code, and read that in every time I made a new GTL program for a graph. Then, make the few changes needed to create the needed graph. While this worked fine, even the few steps needed to get to the file using File->Open Program and navigating through my file folders took too long - especially when someone was looking over my shoulder for the graph!
Now, I have created a "gtl" abbreviation of the above code using the technique outlined in the paper Rick referenced. I also added the ALT+G key sequence to trigger it. So, now I can start with the boiler plate code and get my graph shown below in seconds with following changes:
- Change the title and the X, Y and GROUP role settings.
- Change the data set name and template name in the SGRENDER statement.
- Later, I can customize the template and output image names, etc.
The process is very simple and all the details are provided in the paper "SAS Abbreviations are your friends, use the template method to code!" by Elizabeth Ceranowski. Thanks, Elizabeth and Rick!


1 Comment
Pingback: This week in blogs: abbreviations, innovation and the holidays - SAS Voices