The Aphorisms of the New Defensive Paradigm
I want to finish this blog series with a set of 7 aphorisms – concise statements of principle – that characterize the new Defensive paradigm for business forecasting. The first is that:
Aphorism 1: Forecasting is a Huge Waste of Management Time
This doesn’t mean that forecasting is pointless and irrelevant. It doesn’t mean that forecasting isn’t useful and necessary to run our organizations. And it doesn’t mean that business managers and executives should stop caring about their forecasting issues or stop trying to resolve them.
It just means that the amount of time, effort, and resources spent on forecasting is not commensurate with the benefit achieved – the improvement in accuracy.
We spend far too many resources generating, reviewing, adjusting, and approving our forecasts, while almost invariably failing to achieve the level of accuracy desired. The evidence now shows that a large proportion of typical business forecasting efforts fail to improve the forecast, or even make it worse. So the conversation needs to change. The focus needs to change.
We need to shift our attention from esoteric model building to the forecasting process itself – its efficiency and its effectiveness.
Aphorism 2: Accuracy is Limited More by the Nature of the Behavior Being Forecast than by the Specific Method Being Used to Forecast
Under favorable conditions, demand can be forecast accurately. But under normal conditions, we may never reach the level of accuracy we desire – no matter how much data, statistical analysis, and human intervention we employ.
This is not our fault. It is the reality of dealing with the randomness and variability in what we are trying to forecast. It’s an issue of forecastability.
Perhaps the single best indicator of forecastability, (although it is rightfully criticized as imperfect), is the coefficient of variation (CV).
CV = Standard Deviation / Mean
CV is the ratio of a pattern’s standard deviation to its mean. It expresses the variability (or “volatility”) of a pattern over time. A flat line would have CV = 0. A highly erratic pattern may have CV of 100% or more.
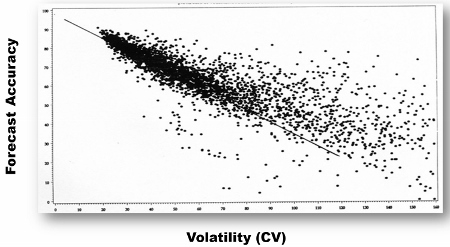
The “comet chart” is an easy way to show the relationship between demand volatility and forecast accuracy at your organization.
 (You can find instructions on how to create this chart in the BFD blog post "The Accuracy vs Volatility Scatterplot," or in The Business Forecasting Deal book.)
This scatterplot compares forecast accuracy (from 0 to 100% on the vertical axis), to the volatility of the sales pattern (as measured by the coefficient of variation) along the horizontal axis. It is based on one year of weekly data for 5000 skus at a consumer goods company. The dots shows the volatility of the sales over the 52 weeks and the forecast accuracy achieved, for each of the 5000 skus.
As you can see, for skus with greater volatility (moving to the right in the plot), forecast accuracy tended to decrease.
That line is not a regression line. It shows the approximate accuracy you would have achieved, at each level of volatility, but using a naïve model. So the way to interpret this chart is that for skus falling above the line, they were adding value with their forecasting process – which was generally the case. However, skus falling below the line were being forecast worse than if they just used the naïve model.
This kind of analysis suggests that whatever we can do to reduce volatility in the demand for our products, the easier they should be to forecast.
Here is another example of a comet chart from a manufacturing company:
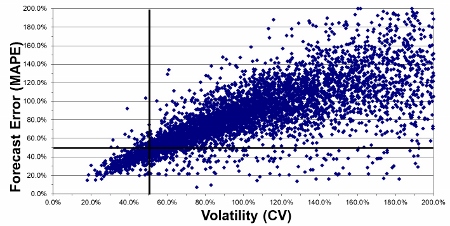 Note that they used MAPE rather than Forecast Accuracy for the vertical axis, so the tail of the comet points in a different direction. But the findings are consistent – the lower the volatility, the more accurate the forecasts.
[See all 12 posts in the business forecasting paradigms series.]