Typical Business Forecasting Process
Let’s look at a typical business forecasting process.
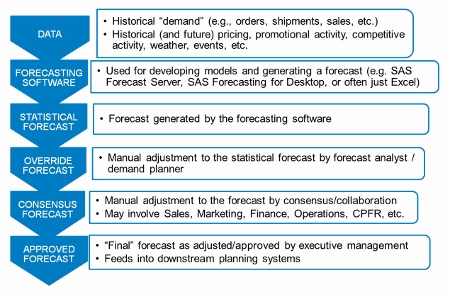
Historical data is fed into forecasting software which generates the "statistical" forecast. An analyst can review and override the forecast, which then goes into a more elaborate collaborative or consensus process for further adjustment. Many organizations also have a final executive review step, where the forecast can be adjusted again before the final approved forecast is sent to downstream planning systems.
The typical business forecasting process consumes large amounts of management time and company resources. And we know that business forecasting can be a highly politicized process, where participants inflict their biases and personal agendas on the computer generated number, especially if what the computer says is not what they want to see.
Under the Defensive paradigm, the important question is not “what accuracy did our process achieve?” but rather, “is our process adding value?” Through all these efforts, are we making the forecast more accurate and less biased?
How would you ever know?
Failings of Traditional Metrics
Common traditional metrics like MAD or MAPE, by themselves, do not answer that question. Morlidge has a nice quote, that “forecast performance can be quickly improved if you know where to look” but that “conventional metrics like MAPE shed little light on the issue.”
Sure, these common metrics can tell you the magnitude of your forecast errors. But by themselves, they don’t tell you how efficiently you are achieving the accuracy you reach, or whether you are forecasting any better than some cheaper alternative method.
These are the sorts of things that FVA analysis aims to find out.
What is FVA Analysis?
You can think of FVA analysis as the application of traditional scientific method to forecasting. You start with a null hypothesis:
Ho: The forecasting process has no effect
You then measure the results of steps in the process to determine if you can reject the null hypothesis, and thereby conclude that there is an effect, either good or bad. There is the nice analogy to testing a new drug for safety and efficacy:
Suppose you have a new cold pill. You find 100 people with colds, randomly divide them into two groups, giving one group the pill and the other a placebo. You then track their outcomes, and if the ones who got the pill get over their colds much faster and suffered less severe symptoms, then you might conclude that the pill had a positive effect. However, if there is little difference between the groups, or if the ones taking the pill fare worse, you can probably conclude that the pill adds no value.
We are doing a similar thing in FVA analysis, with the naïve forecast serving as the placebo.
FVA Analysis: Simple Example
Let’s look at an example of a simple forecasting process:
 Perhaps the simplest process is to read demand history into a statistical forecasting model to generate a forecast, and then have an analyst review and possibly override the statistical forecast.
In FVA analysis you would compare the analyst’s override to the statistically generated forecast – is the override making the forecast better?
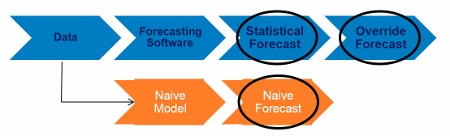 FVA analysis also compares both the statistical forecast and the analyst forecast to the naïve forecast – the placebo.
Stairstep Report
Here is an example of a "stairstep" report for showing the results of an FVA analysis.
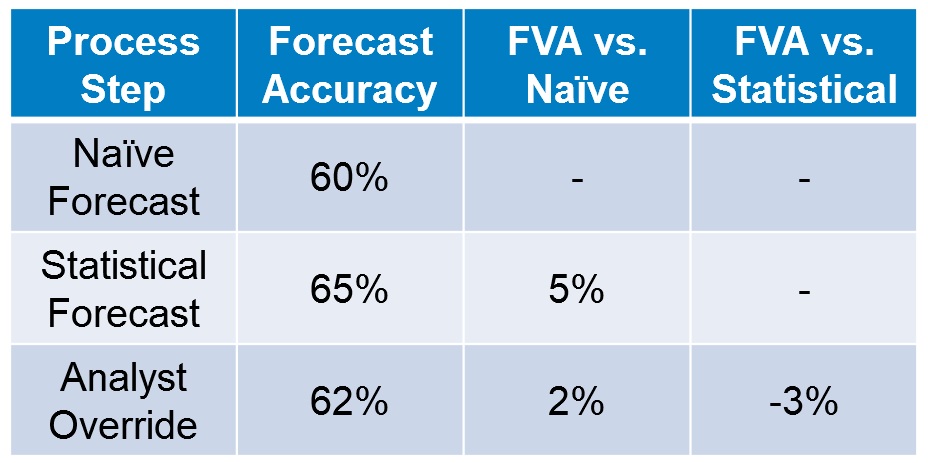 The first column shows the sequential process steps, and the second column shows the accuracy achieved at each step. The rightmost columns show the pairwise FVA comparisons. This can be used to report an individual time series, or as in this example, an aggregation of many series.
These numbers are the actual findings that a large consumer products reported at an Institute of Business Forecasting conference presentation in 2011, across all their products. As you see, the statistical forecast increased accuracy by 5 percentage points. But the manual adjustments to the statistical forecast reduced accuracy by 3 percentage points.
This is not an uncommon finding.
[See all 12 posts in the business forecasting paradigms series.]

1 Comment
Pingback: Vandeput's Data Science for Supply Chain Forecasting (book excerpt) - The Business Forecasting Deal