![]() Sometimes one's job gets in the way of one's blogging. My last three months have been occupied with the launch of SAS® Viya™, our next-generation high-performance and visualization architecture.
Sometimes one's job gets in the way of one's blogging. My last three months have been occupied with the launch of SAS® Viya™, our next-generation high-performance and visualization architecture.
Please take the time to find more information on the SAS Viya website, and apply for a free preview.
Rob Hyndman on Time-Series Cross-Validation
Back in March we looked at Rob Hyndman's article on "Measuring Forecast Accuracy" that appears in the new book Business Forecasting: Practical Problems and Solutions.
Hyndman discussed the use of training and test datasets to evaluate performance of a forecasting model, and we showed the method of time-series cross-validation for one-step ahead forecasts.
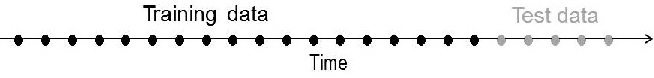 Time-series cross-validation is used when there isn't enough historical data to hold out a sufficient amount of test data. (We typically want 20% of the history (the most recent observations) for the test data -- and at least enough to cover the desired forecasting horizon.)
In real life, we often have to forecast more than just one step ahead. For example, if there is nothing we can do to impact supply or demand over the next two weeks, then the 3-week ahead forecast is of interest.
Hyndman shows how the time-series cross-validation procedure based on a rolling forecast origin can be modified to allow multistep errors to be used.
Suppose we have a total of T observations (e.g., 48 months of historical sales), and we need k observations to produce a reliable forecast. (In this case, k might be 36 months for our training dataset, with the most recent 12 months as our test dataset.) If we want models that produce good h-step-ahead forecasts, the procedure is:
- Select the observations at time k + h + i - 1 for the test set, and use the observations at times 1, 2, ..., k + i - 1 to estimate the forecasting model. Compute the h-step error on the forecast for time k + h + i - 1.
- Repeat the above step for i = 1, 2, ..., T - k - h + 1 where T is the total number of observations.
- Compute the forecast accuracy measures based on the errors obtained. When h = 1, this gives the same procedure as the one-step ahead forecast in the previous blog.
Previously, my colleague Udo Sglavo has shown how to implement Hyndman's method in SAS® Forecast Server in this two-part blog post (Part 1, Part 2).