In the previous installment we were reminded of the potential abuses of forecasting by analogy. People are naturally reluctant to forecast that their new product idea is going to flop. Therefore, there is an inclination to ignore similar items that failed in the marketplace, or apply less weight to the failures than to the successes in calculating the new product forecast.
The structured analogy approach tries to address these abuses. It utilizes data visualization and analytical software to combine the use of analogies with structured judgment, forcing you to make conscious (and hopefully less biased) decisions along the way. The approach begins with two types of data: attributes (of prior products and new products) and historical sales (of prior products).
Attributes can be just about anything relating to the product, such as its type, price point, target market, function or purpose, as well as physical characteristics like color or size. You need to have a file of all previously released products with their attributes, as well as know the attributes of forthcoming new products.
Historical sales of past new product introductions provides both the volume of sales and the shape or profile of the sales pattern during the introductory period. For example, you might capture weekly sales for the first X number of weeks. As we saw last time, it is helpful to display scaled thumbnails of the historical sales patterns, to get a sense of how similar (or variable) these patterns can be.
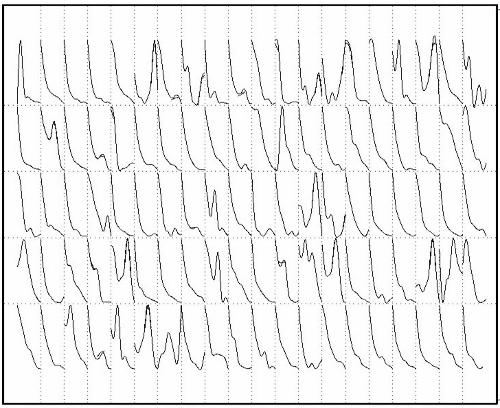
These scaled profiles of the first eight weeks sales for 100 movie DVDs follows a pattern that is unlike most other new product introductions. For movie DVDs, peak sales usually occur in the first week of release, and quickly taper off after that. The distinctiveness of this pattern makes it a good example for illustrating the structured analogy approach.
Six Steps of the Structured Analogy Process
- Query: Identify a set of candidate products that have similar attributes to the new product
- Filter: Option to manually remove inappropriate or outlier products from the set of candidate products.
- Cluster: Cluster the candidate products according to their sales pattern and use judgment to manually select the most appropriate cluster to serve as the surrogate products.
- Model: Select the most appropriate statistical model for the cluster of surrogate products.
- Forecast: Use the statistical model to generate a forecast for the new product.
- Override: Option to make manual adjustments to the statistical model's forecast.
It is obvious that judgment still plays a major role in this process. In each step some kind of decision has to be made (specifying the relevant attributes in Step 1, removing any inappropriate or outlier products in Step 2, etc.). But each decision is now transparent, documented, and subject to management scrutiny.
In the next installment we'll work through these six steps with the DVD sales data.