This is the first post of a multi-part series on EL-T integration. Lately I’ve been inundated with requests for information about SAS’ ability to do EL-T style (Extract Load then Transform) integration with Data Integration Studio, especially in Teradata shops that use SAS, so we thought it would be useful to show how to perform EL-T style integration with SAS' Data Integration Studio. As most data warehouse architects will tell you, a staging layer is required architectural component when dealing with data of size especially if you need to scale your integration processes. Staging is where raw data is first landed from extraction processes. These can be flat files, data sets, excel files, unstructured data etc. With EL-T style of processing we want to take advantage of the simplicity of SQL and the power of relational database technology. You’ll be hard pressed to find folks more passionate about EL-T than our friends at Teradata.
A common load strategy that many of SAS & Teradata customers use is “Mini Batch”. With Mini Batch large or small amounts of data is appended to preexisting tables. Data is fed into staging tables, where it is structured and cleansed as it is merged with target tables, finally base views and application views are created on top. As a best practice, users shouldn’t have direct access to tables; instead they should access data through at least one layer of base views. In Teradata all tables need to have ACCESS LOCKS before querying them in order to maintain a read-consistent view. Let’s see how we can do this in DI Studio…
Suppose I have a file of trades that lands a couple times a day, here is one way to use a mini-batch approach to populate data in Teradata.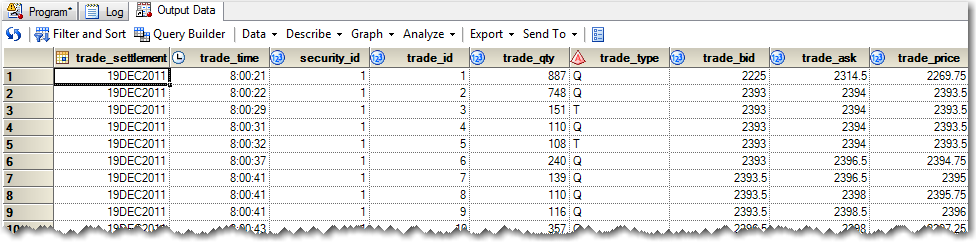
Our file…
Step 1. Register the incoming files with Data Integration Studio.
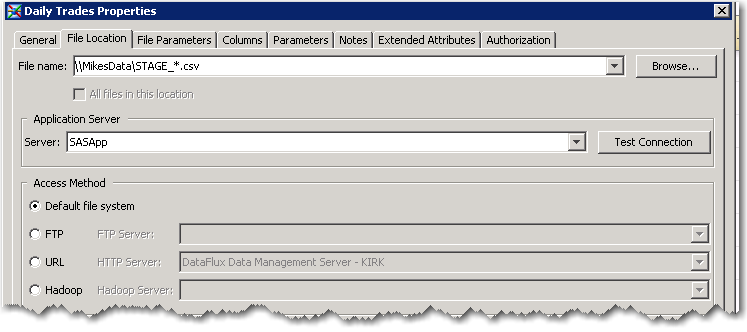
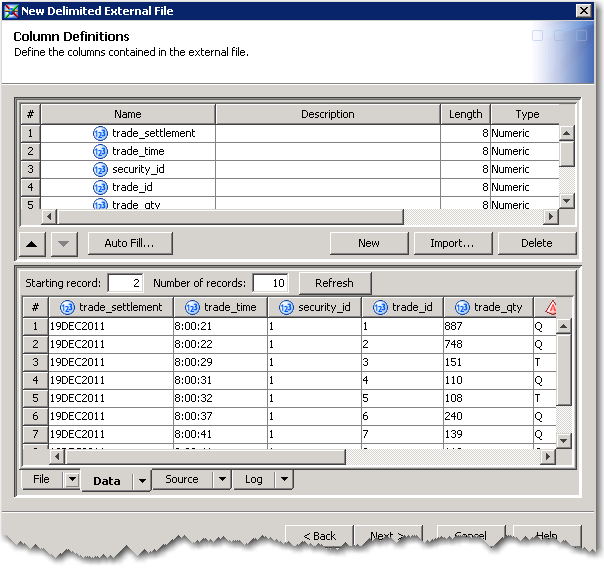
Note the use of the wild card “*” with this you can reference a get a bunch of files rather than just 1. Also files don’t have to be local to the machine; you can FTP them, reference them via URL, or point at files on a Hadoop file system. During the import process I can define the structure of my file(s) and eyeball the data.
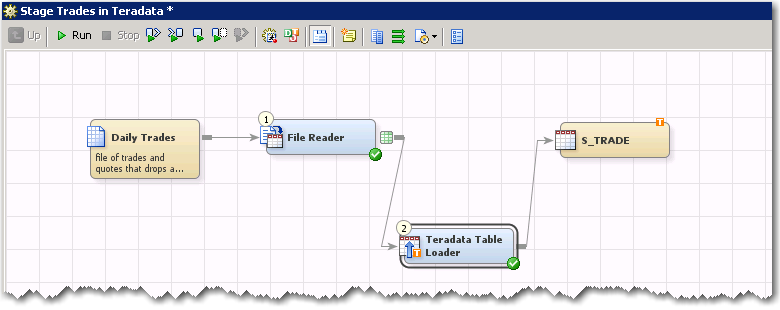
Step 2. – Next I’m going to create a job that will load the files into staging table in Teradata. For simplicity our staging table will mirror the structure of the files(s). Rather than create the staging table outside of SAS I’m going to define it in Data Integration Studio. To do this I simply click register table and off I go. Personally, I prefer to model my databases with an ER tool so I can get an overall picture of the design.
SAS provides a number of options to help define the Teradata staging table ~ S_TRADE
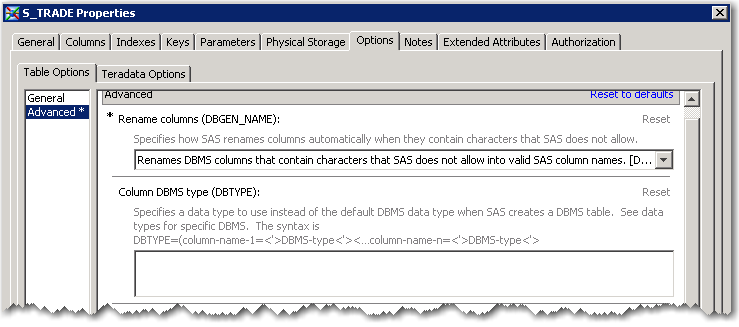
I can override the column data types that SAS assigns by default. Or if I want to take advantage of Teradata’s fancy column compression I can do that here too.
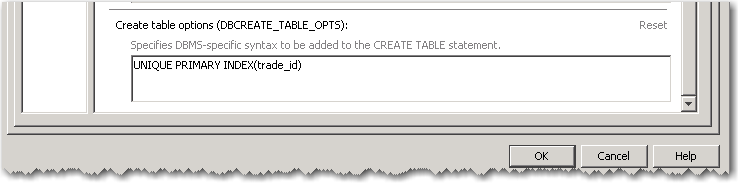
I can define a primary index for the table; in this case I’m defining a UPI (unique primary index) on trade_id. Some folks like to use the NOPI (No Primary Index) tables but I’m old school I want to control how my tables are distributed.
Step 3. – setup the Table loader, in this case we are going to load the staging table with FASTLOAD
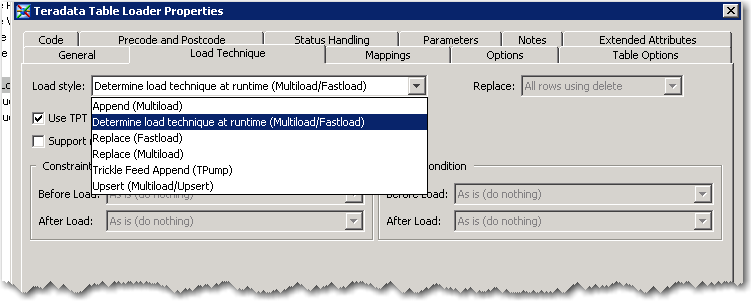
I personally prefer not to let SAS determine load technique at run-time; instead my recommendation is to know up front what load utility you need to use ~ mostly I prefer doing Fastloads “get the data into Teradata then do the work.” Fastload requires an empty table, which is what I want for my staging environment.
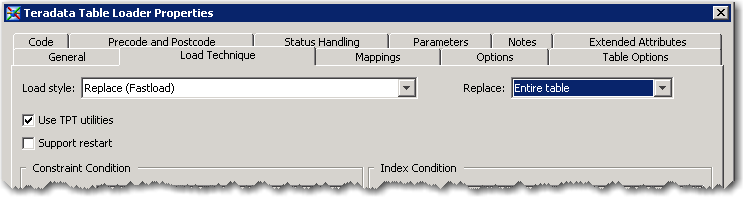
Note SAS supports the TPT api as well as the “classic” load methods. TPT generally is the preferred loader interface. We also support restart-able loads as well.Here I can set various options and even database load specific options.
Finally, to make sure that all is right with the world, I’ll run my job and check the results
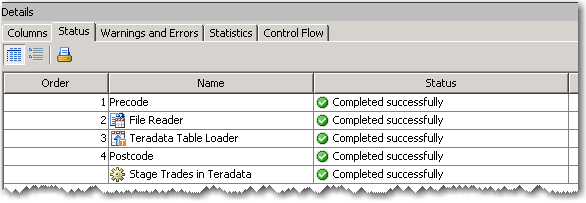
Then I like to go and eyeball the staging table…
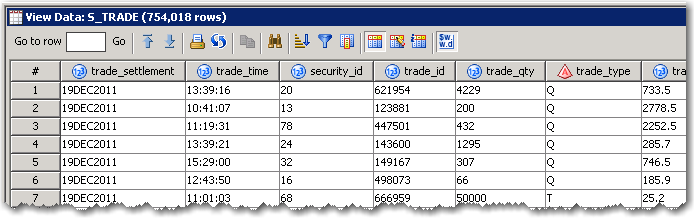
Yep my load is looking good.
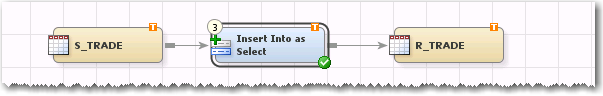
Step 3. I’m going to append my staged data into the reporting table R_TRADE. To do this I use the IIAS transform “Insert Into as Select”. IIAS is a pretty cool EL-T transform it enables you to write a query and map the result from the query to the input columns of the target table. This can either be a push-down query (meaning it is all performed in-database see the little T indicator below), heterogeneous query (meaning I can query one system and stream the inputs into a target table on another without landing intermediate tables as needed), and can invoke the bulk loader for cross system loads and much more. notice the little orange T's that means all the processing takes place in Teradata.
Here are the guts of the transform a query builder and a mapping interface (that is you map the results of the SELECT to the Target Table)
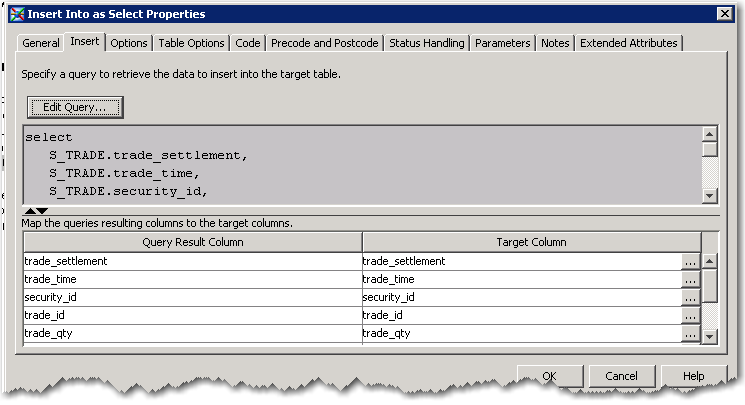
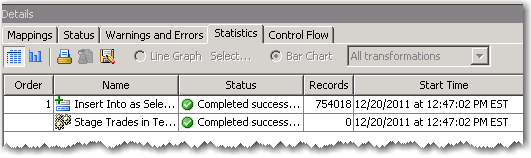
So I run it and check the results, 754k records appended in just a few seconds not too shabby.
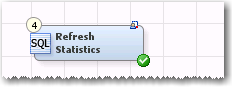
Step 4. Next I need to “Collect Statistics” on the target table if I’ve appended a significant amount of records. In this case, let’s assume that I’ve added a significant number of records to the target table and the statistics are out of date. But first I’ll digress here a bit. All modern RDBMS (I can’t think of one that doesn’t) uses a cost based optimizer. Teradata is no different. Query optimizers depend on the table statistics to formulate the least costly query execution plan from dozens if not thousands of possible query plan permutations. Without statistics the optimizer often phones home and can choose some strange query plans. Some databases go back to their optimization roots using rule based optimization; others like Teradata simply take sample. In either case, having up-to-date statistics is a key step to getting performance. Here is how you do it.
1. Drop a SQL execute node onto the job.
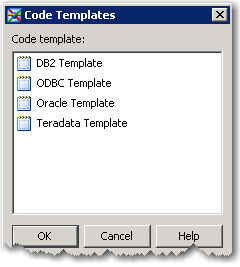
2. Add a Teradata template in this case I have a template for Collecting Statistics, templates are nice when I have to do the same thing over and over again. Fortunately they can be parameterized too.
3. Fill out the template and run it.
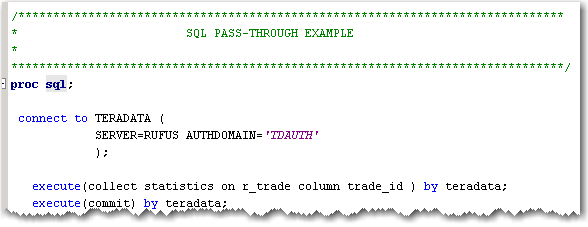
Notice the use of SAS’ Authorization domain; this simplifies the connection stuff that I have to worry about. For instance I don’t have to have plain text passwords in code, nice right.
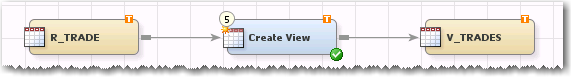
Step 5. – Last step is to publish the data for consumption. So I’ve loaded data from a file to a staging table, I did some simple cleanup and structuring in the staging layer and “load-appended” new data to my target reporting table, to publish my data I simply update the reporting view that my users use. To do this I simply change a WHERE clause to make the newly appended data available ( something like WHERE LOAD_TIME <= cast(‘03:00:00’ ,as time) . The reporting view is provided to end users as the only way to query the table. There are a number of reasons for this including locking in certain databases, security, performance and finally most importantly usability. Once I do this users will now have access to the newly published data.
Success with EL-T starts and ends with a solid database design, architecture and integration tools and techniques that take advantage of the features of the underlying relational database system. Parallel databases like Teradata have a rich set of SQL features and load utilities to aid the user to Stage, Structure and Cleanse data within the database. I’ve purposely not focused on SAS’ Access technology and instead focused on SAS’ Data Integration Studio for EL-T integration. SAS/Access is the underlying RDBMS connectivity technology from SAS. It provides a rich set of features and functionality that at a very low level. In the coming weeks I’ll being to break down other EL-T techniques such as trickle feed, in-database data quality and validation, match-merge and SQL based structuring for analytic analysis in more detail and with different RDBMS systems.