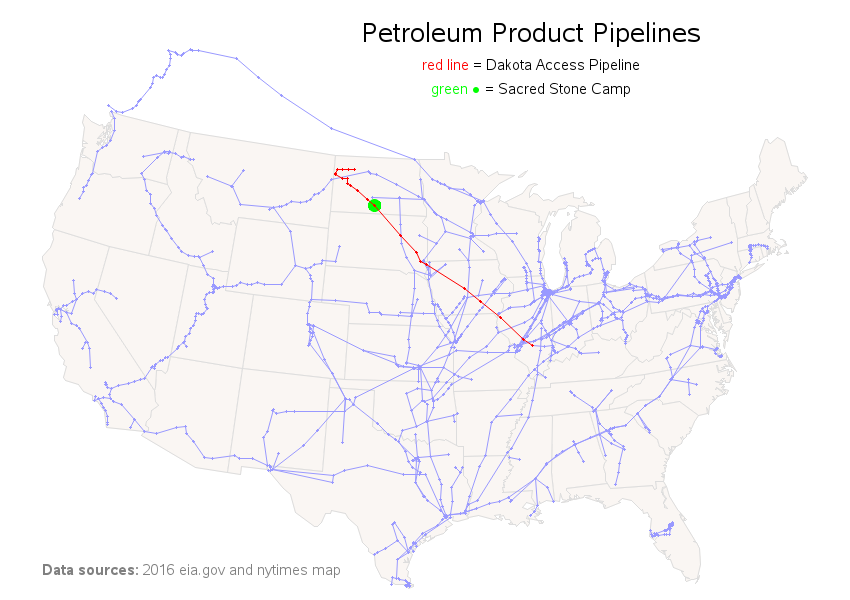
Yearly Archives: 2016

Data Visualization | Students & Educators
Katrina Miller 0
Dashboard vs. Scorecard: Measuring the Impact of Educator Preparation

With educator preparation programs (EPPs) under fire, states must make difficult decisions on how to hold EPPs accountable, provide information for program improvement, and offer consumer information to the public on EPP efficacy. In conversations I’ve had with state leaders grappling with this issue, I have seen a debate arise

Data Management
Jim Harris 0
Managing data where it lives

Historically, before data was managed it was moved to a central location. For a long time that central location was the staging area for an enterprise data warehouse (EDW). While EDWs and their staging areas are still in use – especially for structured, transactional and internally generated data – big

Rick Wicklin 0
Create a Koch snowflake with SAS

I have a fondness for fractals. In previous articles, I've used SAS to create some of my favorite fractals, including a fractal Christmas tree and the "devil's staircase" (Cantor ) function. Because winter is almost here, I think it is time to construct the Koch snowflake fractal in SAS. A

Data Visualization
Sanjay Matange 0
Financial graphs

Browsing on the web, I ran into a simple but visually interesting graph of financial data.  Really, it could be any data, but this one showed up under "Financial Graphs".  I thought this would give me an opportunity to speak about an interesting new feature added to SERIES plot with

Customer Intelligence
Héctor Cobo 0
El cielo es el límite: El empoderamiento de las organizaciones a través del análisis de big data desde la nube

Cotidianamente las empresas se enfrentan a la toma de vitales decisiones de negocio, desgraciadamente muchas de ellas se ven en la necesidad de hacerlo sin la certeza que éstas sean idóneas, ya que el panorama en el que deben analizar no es totalmente claro. Esta toma de decisiones ciegas tienen

Analytics
Jennifer Bell 0
Pennsylvania principal uses student projections to foster academic success for more students

This student projections post kicks off a series highlighting education leaders sharing the celebrations, and challenges, of using data to drive school improvement. These are real teachers, principals and superintendents working to foster academic growth for every student in their schools and districts. As we near the end of the first

Advanced Analytics | Analytics | Data Management
Christian Engel 0
IDV: Banken müssen Spagat zwischen Flexibilität und Governance schaffen

IDV (Individuelle Datenverarbeitung) ist ein Thema, das in den Banken als Teil von BCBS 239 seit Langem kritisch diskutiert wird. Ruppert Jaeschke betreut und berät seit fast 15 Jahren zahlreiche deutsche Banken im Umfeld Business Intelligence und SAS. Er hat eine klare Meinung zu diesem regulatorischen Thema. Frage: Welche Schmerzen

Fraud & Security Intelligence | Risk Management
0
Perseguir el fraude: un paso más dentro del proceso de negocios exitosos

Dentro de toda compañía la búsqueda del éxito es una constante, sin embargo, para alcanzarlo el primer paso es minimizar y de ser posible desaparecer todos los factores de riesgo que puedan ponerlo en peligro, por ejemplo, el fraude. Diversos son los factores que pueden dar paso a la presencia

Analytics | Fraud & Security Intelligence
0
Aus Schaden klug werden: Wie man auf Konferenzen von Betrugsfällen lernt

Konferenzen rund um die Betrugserkennung mit Analytics sind eine wichtige Informationsquelle im unaufhörlichen Kampf gegen Kriminalität – für unsere Kunden, für unsere Wettbewerber, für uns selbst. Auch heute noch ist es ein Tabu einzugestehen, dass man Opfer eines Betruges wurde, und kaum ein Unternehmen spricht offen darüber. Denn absolut niemand

1 2 3 4 5 45